



Standard Chartered gave ENA a $2 target and Ethena Pay a single paragraph. We used Glasscade data to work out what Pay could actually add to that number, from bear case to bull, and why USDe’s existing distribution gives it a head start most crypto cards never get.
In September, one card program on our tracker grew its monthly volume by 511%, the fastest of the 25 programs we index. Days earlier, a global bank had told clients that the same company’s token could rise roughly sevenfold by the end of 2028, and its case for that barely relies on the card at all.
The program is Ethena Pay. In end Sep, Standard Chartered initiated coverage of ENA with a $2.00 end-2028 target and built almost the entire forecast on one variable: how much USDe exists. Ethena Pay gets a paragraph, as one of two new business lines whose revenue will feed ENA buybacks, with no figure attached.
This piece sets Glasscade’s first three months of Ethena Pay data against the bank’s own buyback maths to answer one question: how large does the card have to get before ENA holders should price it in?
The short answer is about $9.5B of card volume a year, around 400 times today’s run rate.
How Does Standard Chartered Get To $2?
The bank’s model runs in a straight line from stablecoin supply to token demand:
USDe earns yield → Ethena keeps a share as net revenue → 95% of net revenue from every Ethena-branded business line goes to buying back ENA
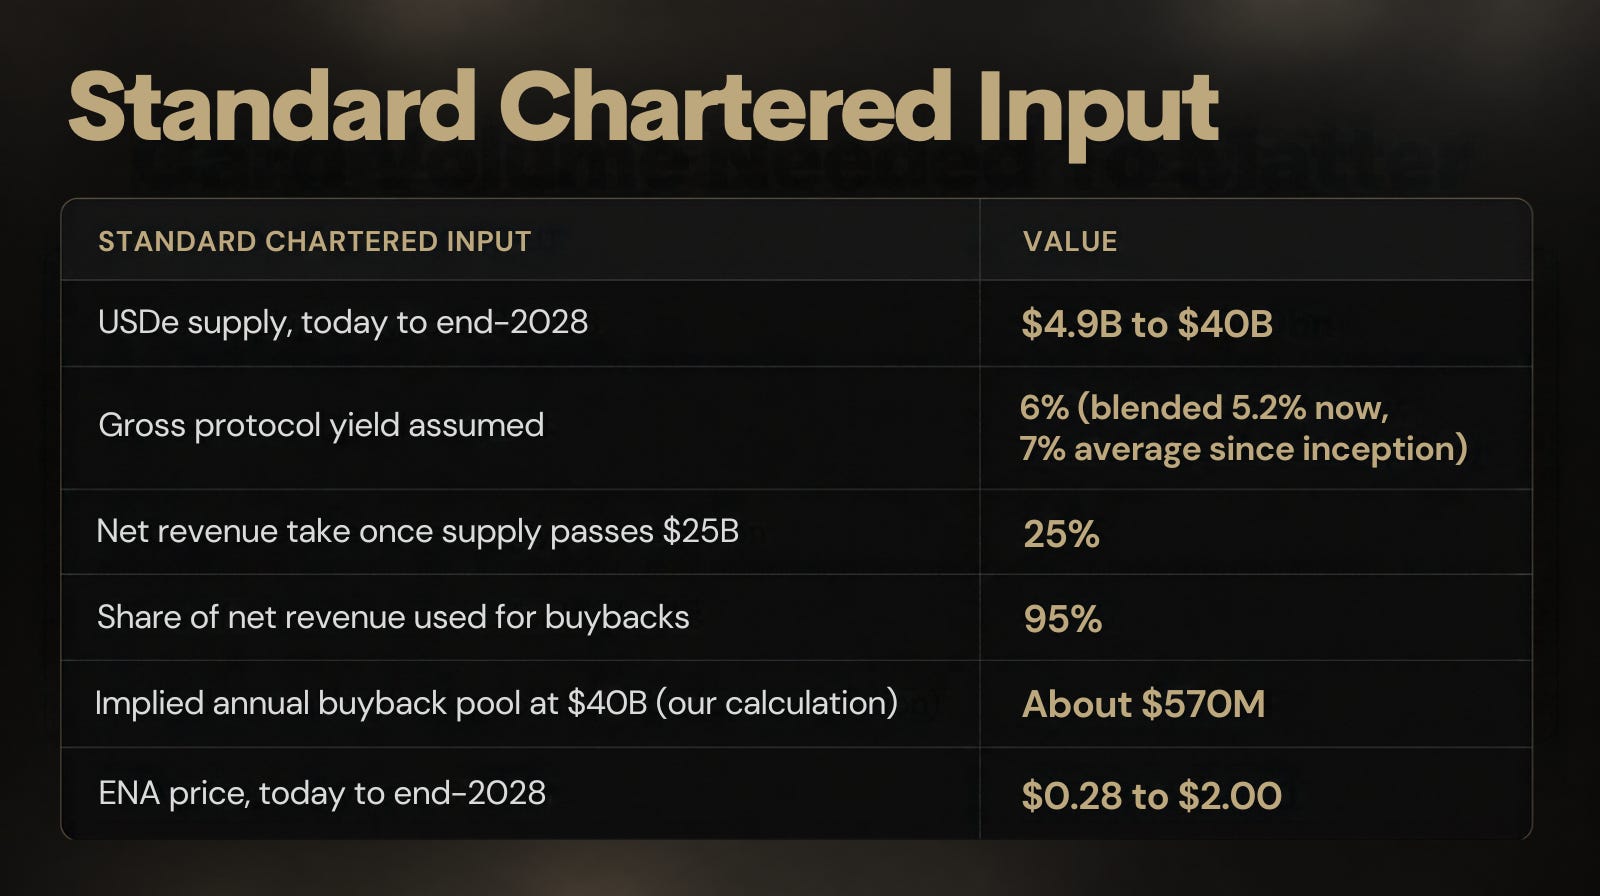
Every input above scales off a single variable, USDe supply, which is why the forecast works whether or not Ethena Pay ever gets big. The part worth borrowing is how the bank turns buybacks into a price:
At today’s $2.5B circulating market cap, the end-2028 pool would retire close to a quarter of supply every year, a pace the bank considers unsustainable.
Uniswap’s buybacks settled at 3 to 4% of market cap a year after UNI roughly tripled, so the bank assumes ENA reprices until it lands in the same range.
At a 3.5% buyback yield and about 8.9B ENA circulating ($2.5B divided by $0.28), each $10M of eligible net revenue becomes $9.5M of buybacks, supports about $270M of market cap, and adds close to 3 cents per ENA.
That gives us a materiality line for any single business inside Ethena → roughly $57M of net revenue a year, a tenth of the bank’s pool, before holders would notice it in the price.
How Fast Is Ethena Pay Growing, And From What Base?
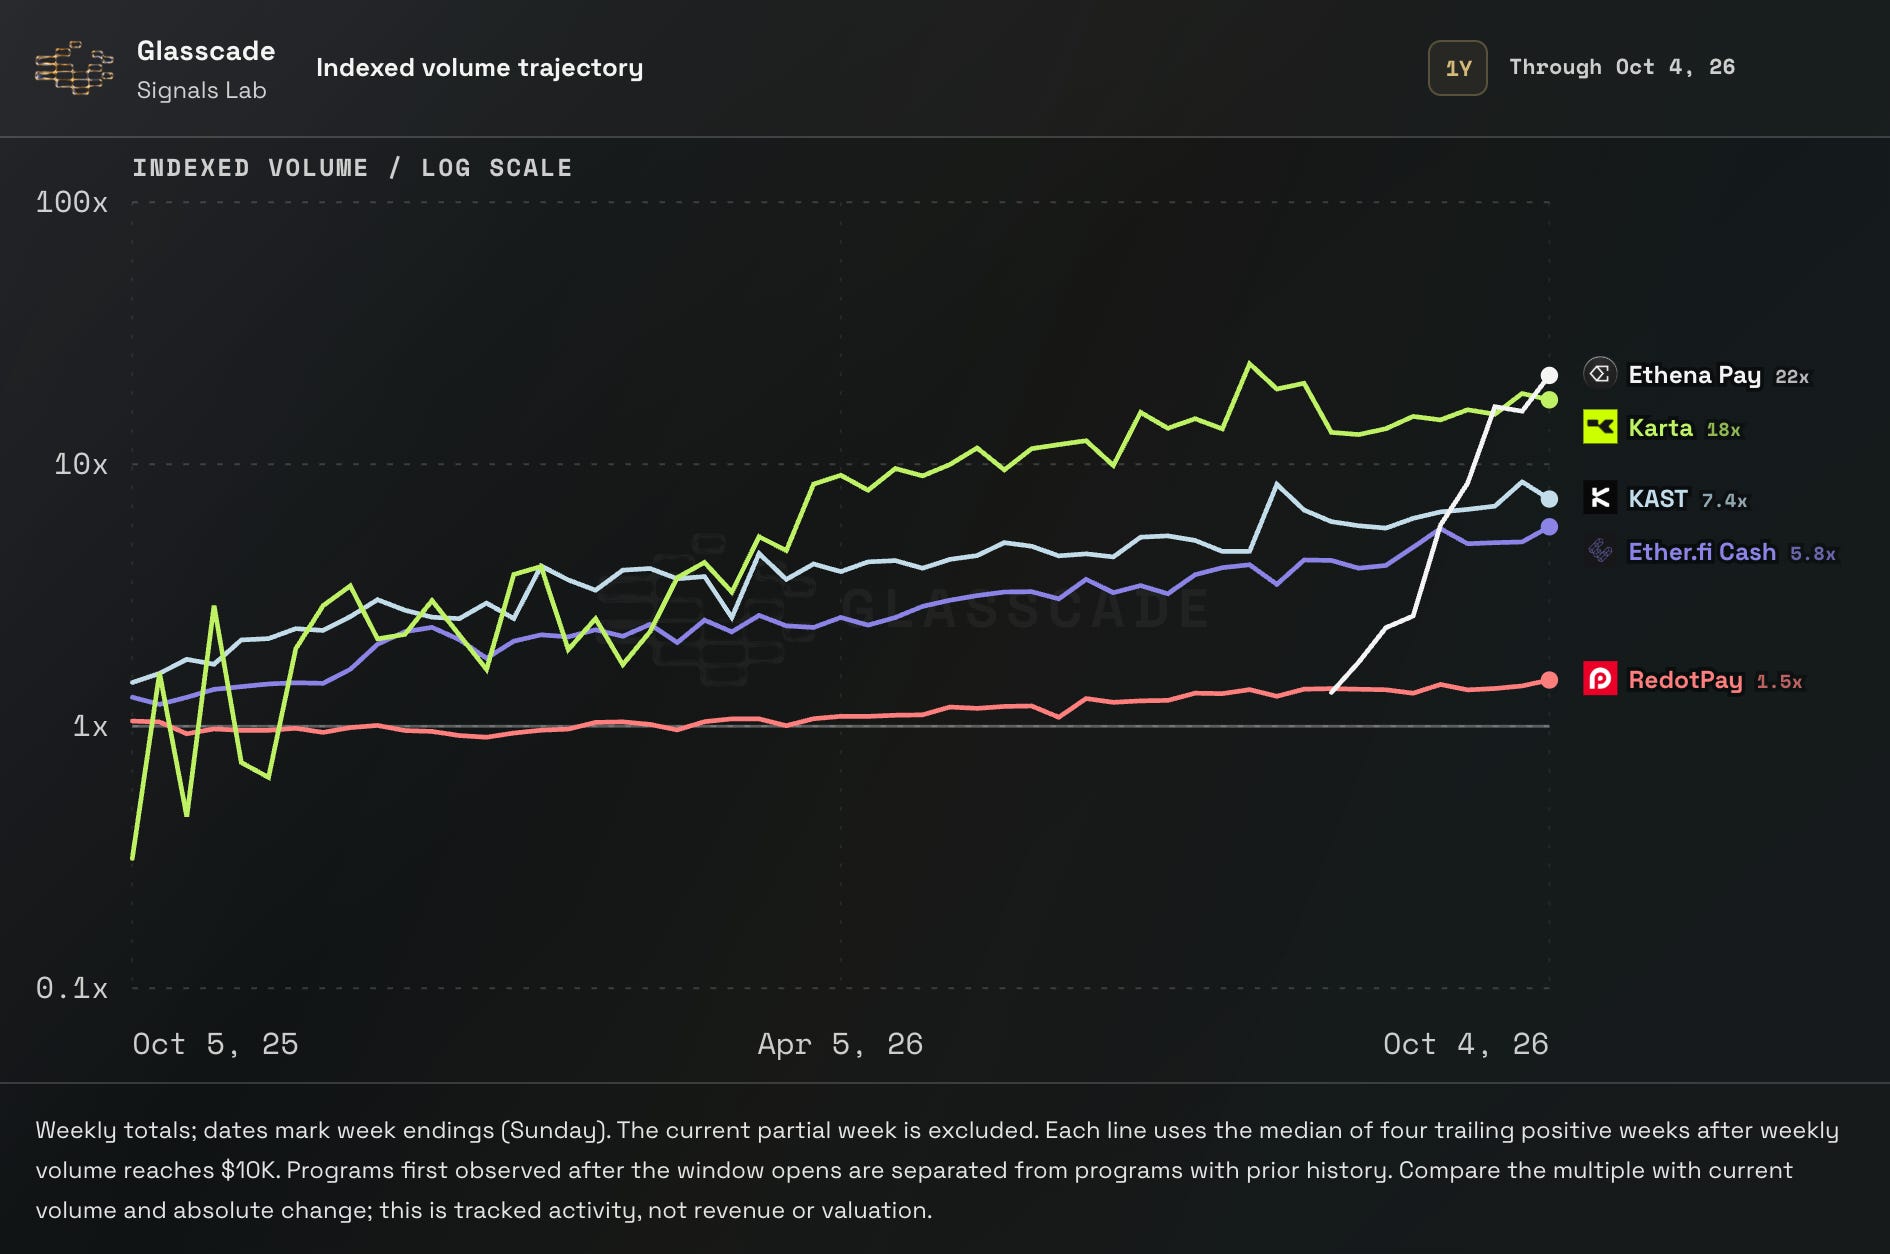
On an indexed view, Ethena Pay overtakes every established program on the chart in about nine weeks. The index flatters newcomers as each line starts from the median of four trailing positive weeks once weekly volume clears $10K, so a two-month-old program is measured against a very small base.
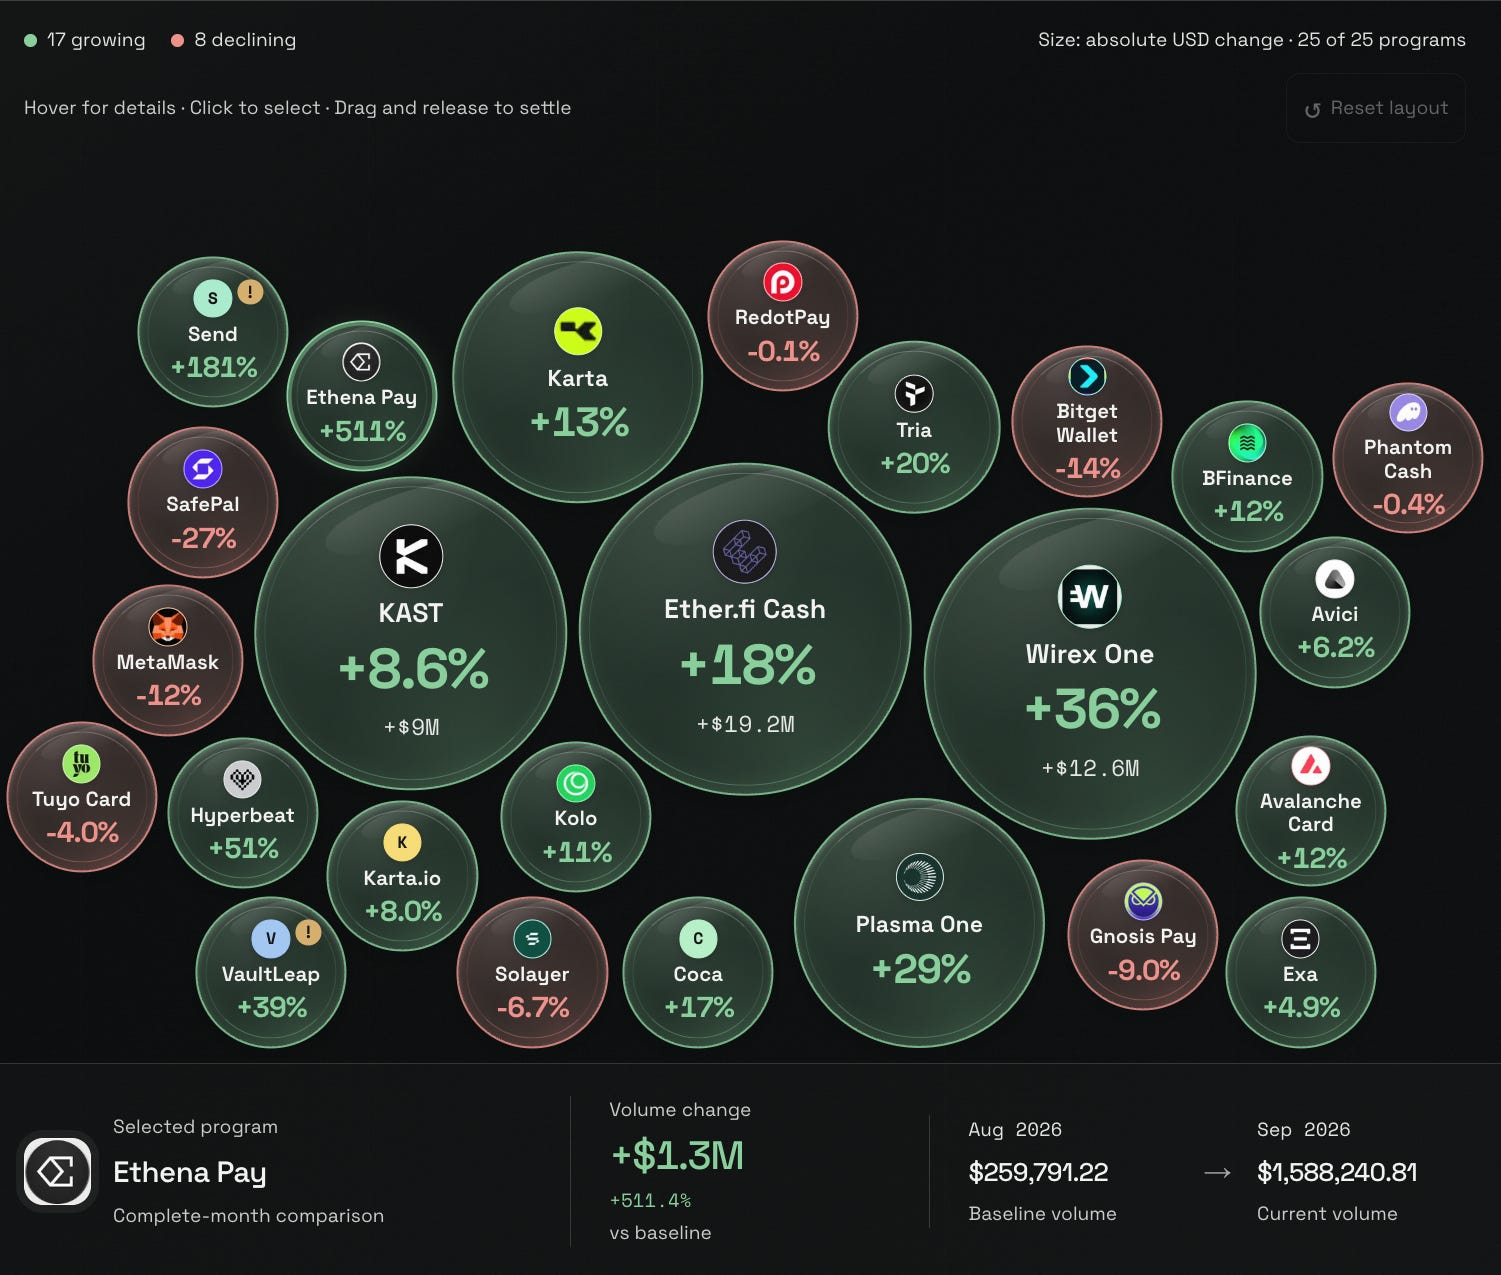
Ethena Pay posts the biggest percentage on the board inside one of its smallest bubbles, while the programs that added the most money did it on modest growth rates from much larger bases.

The ranking table puts both facts on one row → Ethena Pay leads on growth and trails on size, with KAST’s 30-day volume roughly 60 times larger.
One definition matters before any of this goes into a revenue model, because Glasscade measures these programs in three different ways:
Transfers to the card issuer (Ethena Pay, KAST, Coca): money moved to fund the card.
Recorded at clearing (Plasma One, Hyperbeat): transactions as they settle.
Card spending (Exa, Tria, Wirex One): purchases on the card.
A top-up is not a purchase. Users can fund a card and never spend, or spend down a balance funded weeks earlier. We use Ethena Pay’s figure as a proxy for card volume from here on, and a single disclosure from Ethena could close that gap.
Who Is Using It, And How Much Does Each User Spend?
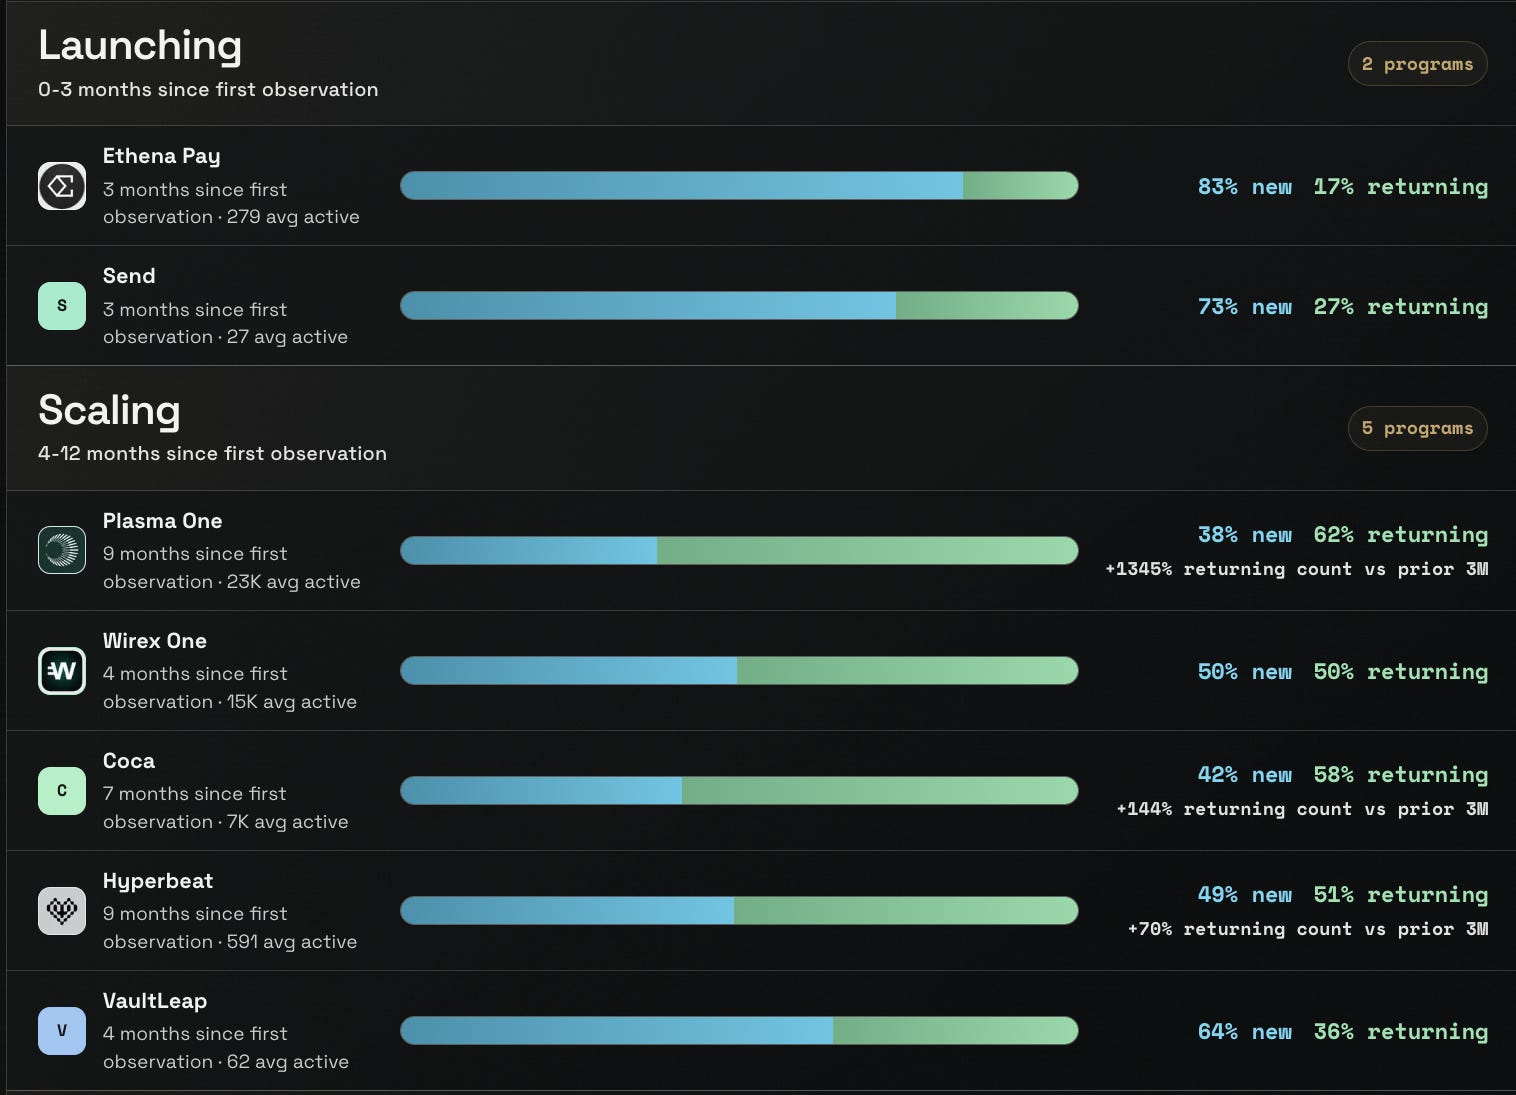
Ethena Pay is still in launch mode.
A small base made up mostly of first-time users, while the programs a few months further along have already tipped towards returning users.
The average actives gives a rough sense of how hard each user is spending:
Ethena Pay: about $6,900 per active user per month
Wirex One: about $3,000
Plasma One: about $1,150
The windows don’t line up exactly (average actives span each program’s life, volume spans 30 days), so read these as orders of magnitude.
Even so, the pattern is clear. Ethena Pay’s early users are few and large, which fits a product launched into an existing base of USDe holders rather than the general public.
Spend per user will fall as that base widens, because no card program scales by finding more people who spend $6,900 a month, and with so few returning users, retention can’t be read yet. Plasma One shows what the signal looks like once it arrives, with its returning count up 1,345% on the prior three months.
Why Could Ethena Pay Scale Faster Than Other Crypto Cards?
Most card programs on our tracker have to find their users first. Ethena Pay launches on top of a stablecoin that already sits inside some of the largest venues in crypto and traditional finance. According to Standard Chartered, USDe is integrated into:
Retail brokers and exchanges: Robinhood, Coinbase, Binance and Bybit.
Institutional infrastructure: BlackRock’s Aladdin platform.
That footprint gives Pay three advantages most cards lack:
A ready-made user pool: $4.9B of USDe and $1.3B of sUSDe outstanding, held by people who already own the asset the card spends. The early cohort’s high spend per user suggests that is exactly who signed up first.
A savings rate it owns: the bank notes that USDe yields let Pay offer higher savings rates than traditional banks. Most crypto cards rent their yield from someone else; Ethena issues the dollar and earns it.
Vertical integration: as a scaled issuer of dollars, Ethena can own every layer from the stablecoin to the card, which the bank singles out as its edge over similar products and which leaves more of each dollar for ENA.
These integrations are distribution for USDe, not yet funnels for Pay. The bull case depends on turning that reach into card users, and the markers later in this piece are how we’ll see it happening.
Caught your attention yet? Subscribe to Glasscade to not miss out on these insights.
How Much Card Volume Would Ethena Pay Need To Matter?
A card program earns interchange on every purchase, but the issuer, network, program manager, cashback and fraud losses all take their share before the brand on the card sees anything. What Ethena keeps per dollar of spend is the biggest unknown in this exercise, so we model a range of 0.25% to 1.25%, centred on 0.6%, and work backwards:
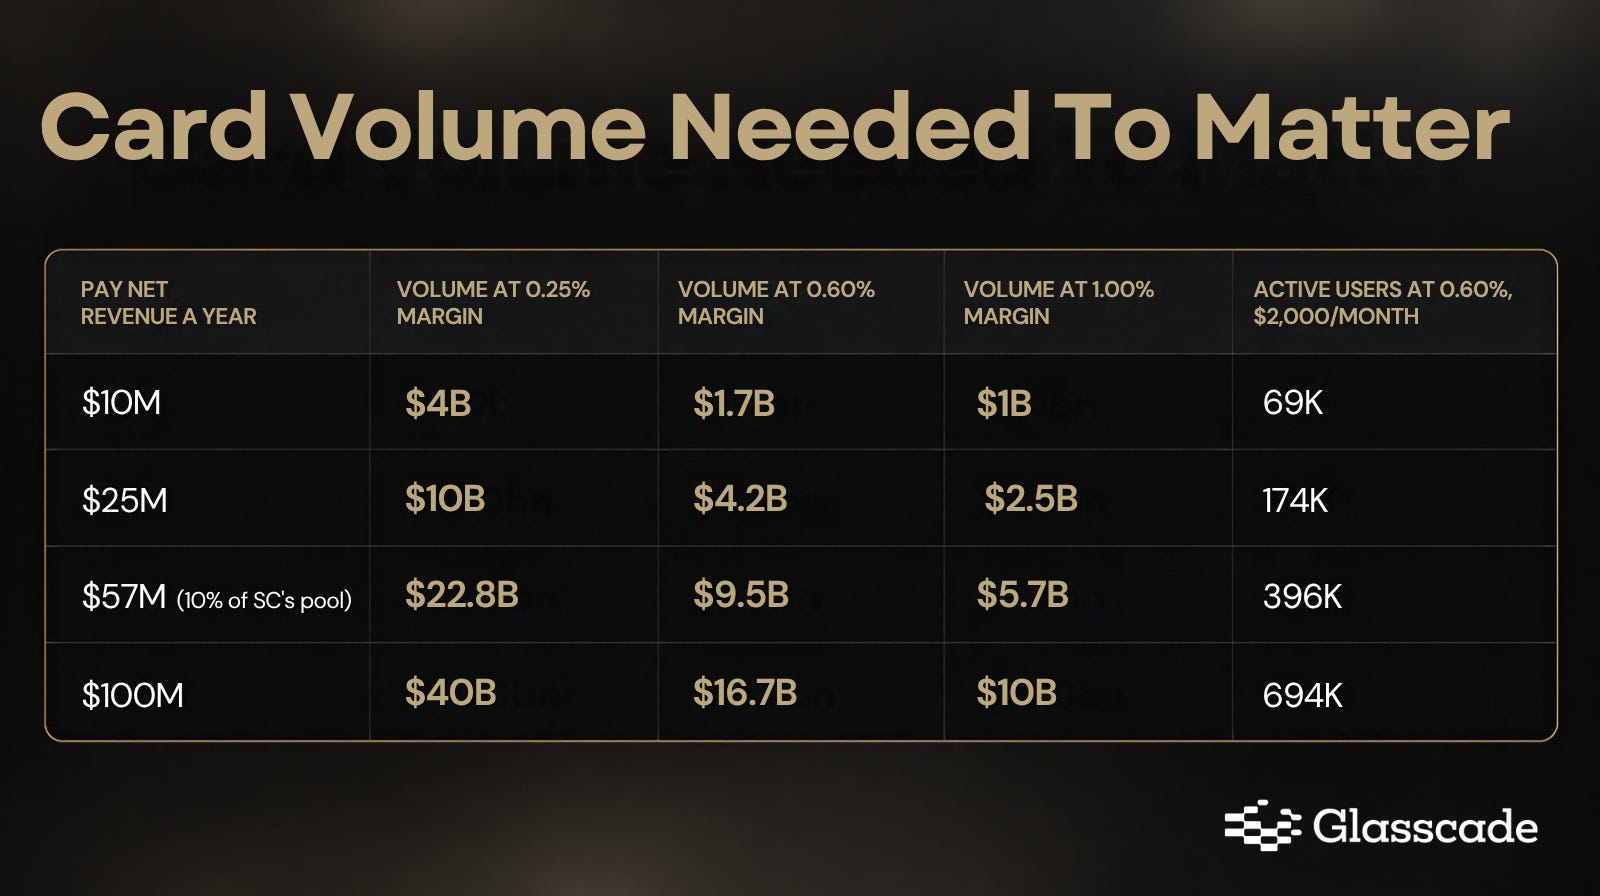
Whichever margin turns out to be right, every route to the materiality line runs through billions of dollars of annual volume and hundreds of thousands of active users.
Compared to where Ethena Pay stands today, that gap looks like this:
Volume: today’s run rate of about $23M a year is roughly 410 times short of the materiality row at a 0.6% margin.
Monthly pace: Ethena Pay would need close to seven times KAST’s latest 30-day volume, every month.
Users: the base required is about 17 times Plasma One’s current actives.
The gap is large, but Ethena Pay doesn’t have to build an audience from nothing to close it. Standard Chartered puts the potential market for this kind of stablecoin neobank at hundreds of millions of retail users globally; the materiality line needs a few hundred thousand of them.
How Much Do Savings Balances And ENA Locks Add?
Ethena Pay is pitched as a neobank rather than only a card, so a user can create value by holding USDe before spending a cent. Per dollar, the two engines feed ENA at different rates:
Balance: about 1.4 cents a year to buybacks per dollar held (6% gross yield, 25% net take, 95% to buybacks).
Card spend: about 0.57 cents per dollar spent (0.6% margin, 95% to buybacks).
One user, both engines: someone holding $2,500 and spending $2,000 a month sends about $137 a year through the card and about $36 through the balance, because spend turns over every month while a balance sits still.
Given how concentrated Ethena Pay’s early users are, many are probably existing holders moving funds across, which makes balances support for the bank’s supply forecast rather than an addition to it.
ENA locking is a separate lever. If higher Ethena Pay tiers come to require locked ENA, that shrinks tradable supply without creating revenue, so it never belongs in the buyback figures.
How Much Could Ethena Pay Earn Across The User Range?
We fixed the user count and let everything else vary, running 20,000 simulations at each step across spend per user, net margin, balances and yield. Active users run from 100K to 10M at six fixed levels: 100K, 250K, 500K, 1M, 5M and 10M, and spend per user falls as the base grows.
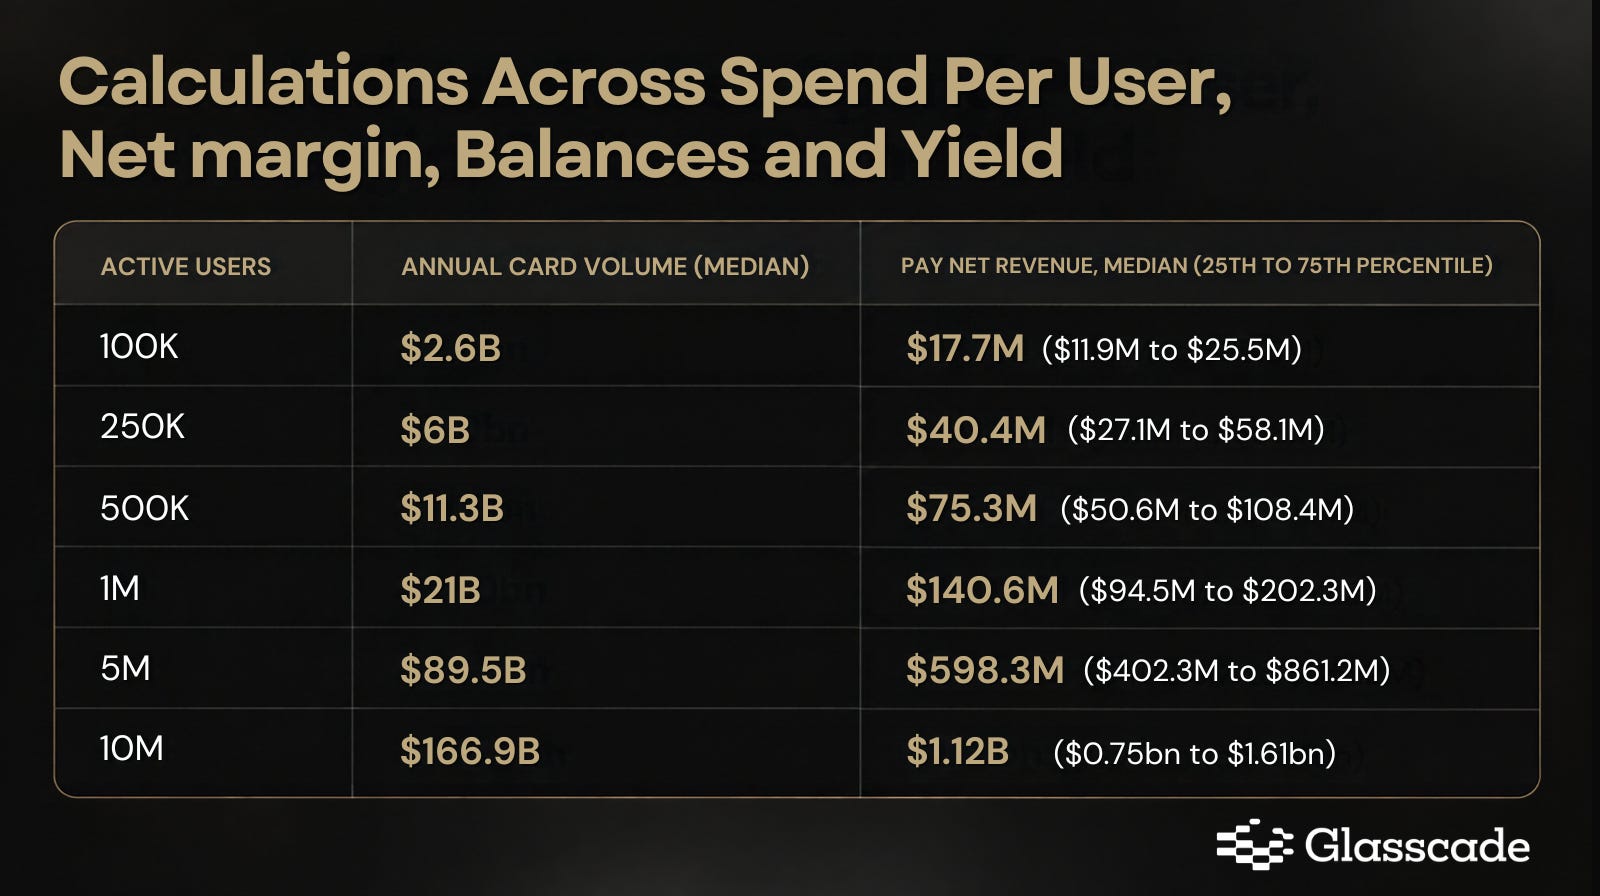
Revenue grows more slowly than the user count, because spend per user dilutes as the base widens: a hundredfold increase in users buys roughly a sixtyfold increase in revenue. Within every row, the upper quartile sits about twice as high as the lower one, which is the margin uncertainty showing through.
Ethena Pay’s Bear, Base And Bull Cases Compared With Standard Chartered’s $2
Let’s compare with Standard Chartered’s assumptions.
Each case is one user level from the grid above with median economics: 100K for the bear case (a working product that stays niche, about four times Plasma One today), 500K for the base, 1M for the bull, and 5M as a tail. The verdict for each depends on how Ethena Pay’s buybacks compare with the bank’s pool:
Immaterial: under 10% of the pool.
Meaningful incremental contributor: 10% to 50%.
Large enough that the USDe-centric valuation understates ENA’s earnings power: above 50%.
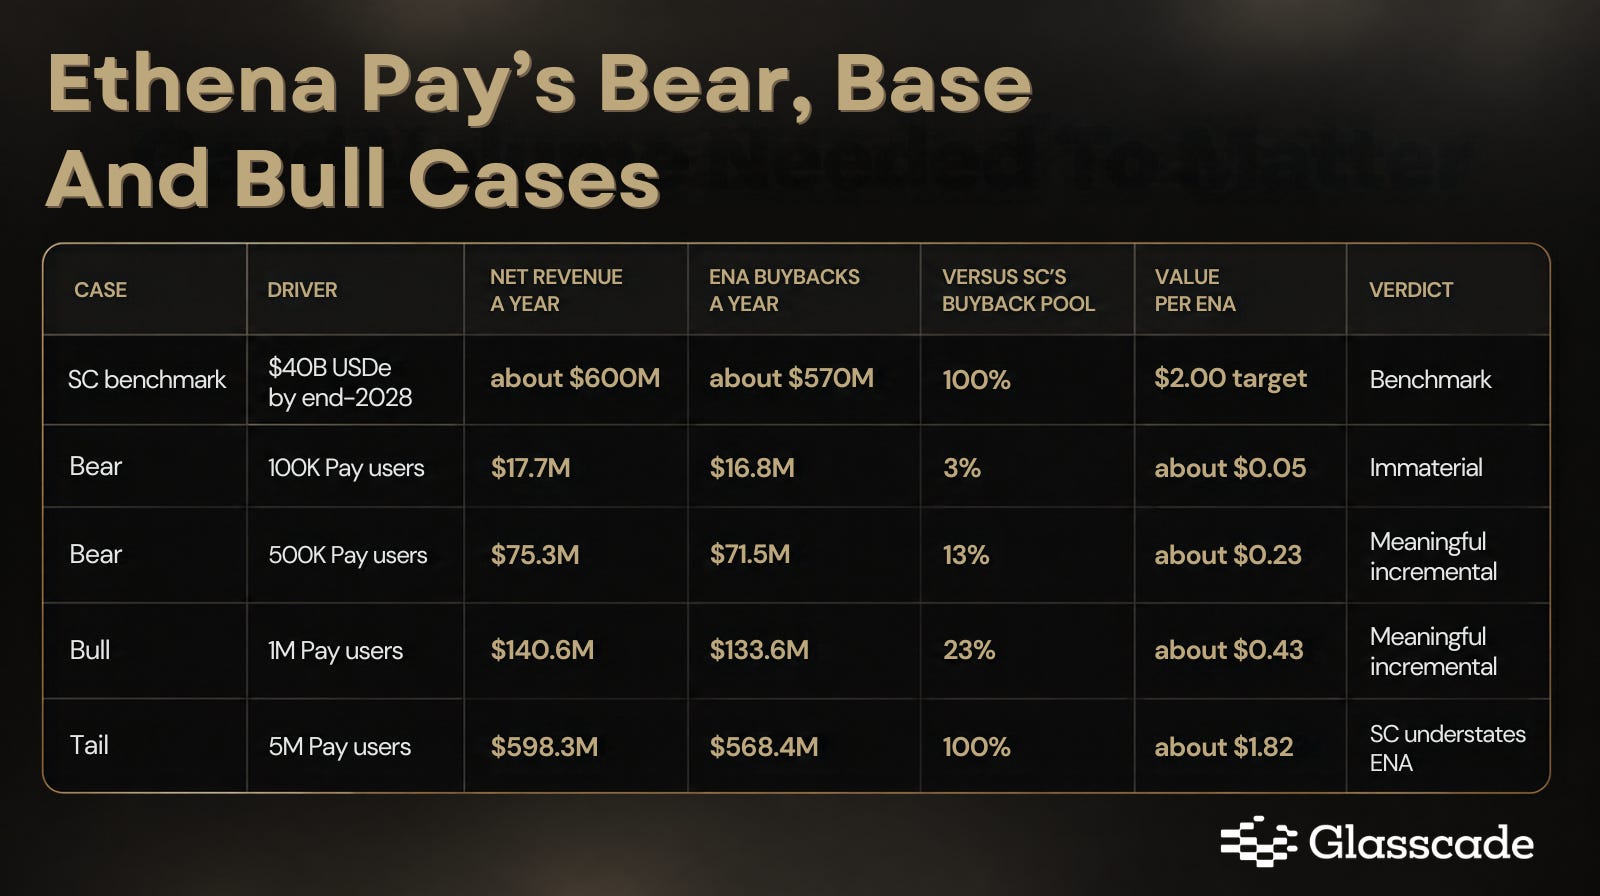
The bear case leaves the bank’s framework untouched, but the base and bull cases add buybacks the $2 target doesn’t include at all, and at 5M users Pay alone would match the USDe engine the whole forecast rests on.
No crypto card we track is near that scale today, but none of them launched with USDe’s distribution behind it either. Adding balance revenue on top of card revenue lifts each case by about a quarter.
Where Ethena Pay sits today, and the markers on Glasscade that would show it closing the gap:
Users: 279 average actives, against 23K at Plasma One, the largest base we track. The materiality line sits between 250K and 500K.
Retention: 17% returning today. Above 50% would match where Plasma One was by month nine, and a savings product has no reason to retain worse than a chain card.
Volume: $1.92M over the last 30 days. Passing $100M a month, roughly KAST’s current level, would put Pay about an eighth of the way to the materiality run rate.
Spend per user: about $6,900 a month today. Holding above $2,000 as the base grows, rather than sliding towards Plasma One’s level, would keep the table’s assumptions intact.
The per-ENA column uses the bank’s own 3.5% equilibrium buyback yield and 8.9B circulating supply, and assumes all of Ethena Pay’s net revenue qualifies for the 95% buyback. That rests on the fee switch covering every Ethena-branded line.
Ethena Pay is currently a cheap option inside the ENA thesis: it costs the bank’s $2 case nothing if it stays small, and the data will show which way it is heading long before buybacks do.
Honestly, two numbers from Ethena would tell us more than everything above.
First, how much it actually keeps from each dollar spent on the card.
Second, whether the money people load onto the card is roughly what they end up spending.
With those, the materiality table offers more certainty in the modelling. Until then, all we really know is that a 511% month means Ethena Pay is heading the right way and could be a strong contributor to the ENA bid.
The information contained in this report and by Glasscade and related affiliates is for general informational purposes only and is not intended to provide legal, financial, or investment advice. The report should not be construed as an offer or solicitation to buy or sell any security, token, or financial instrument and does not represent any recommendation or endorsement of any investment or financial product or service. Glasscade and related affiliates are not registered as a securities broker-dealer or an investment advisor in any jurisdiction or country.
Subscribe to Glasscade to receive valuable insights on stablecoin cards, neobanks, and onchain FX.