

Glasscade turns fragmented transactions and company information into comparable intelligence for stablecoin cards, onchain neobanks, and the infrastructure powering them.
Financial services are moving onto public blockchain rails. The transactions may be visible, but their financial meaning often is not.
A token transfer does not tell you whether it represents a card payment, account funding, issuer settlement, a refund, an internal transfer, or treasury activity. An address is not automatically a customer. Two providers can report “volume” while measuring entirely different parts of a payment flow.
This creates a paradox: onchain finance produces an extraordinary amount of public data, yet basic market questions remain surprisingly difficult to answer.
Glasscade_xyz is an independent research and analytics platform built to make this market legible. The results are shown in each metric: what it represents, where it came from, how confident the reading is, and what it cannot establish.
Stablecoin cards are where we start, because they sit directly between public blockchain infrastructure and private payment systems, exposing some events onchain while leaving others visible only as reported figures.
The eight questions below are that process applied.
Question 1: How Much Activity Can We Actually Observe?
In July 2026, monthly tracked card activity across Glasscade’s coverage reached $1 billion, up 16.6% on June. Total tracked history stands at $11.03 billion across 23 programs.
The growth is real but the headline needs a definition before it means anything.
We call this tracked volume, not total card spend. The market series combines several types of activity: payment events, clearing, authorization-stage debit, program-issuer settlement, and issuer-reported spend.
These events sit at different stages of a card transaction and are not economically interchangeable. Adding them together produces a figure that measures presence, not spend.
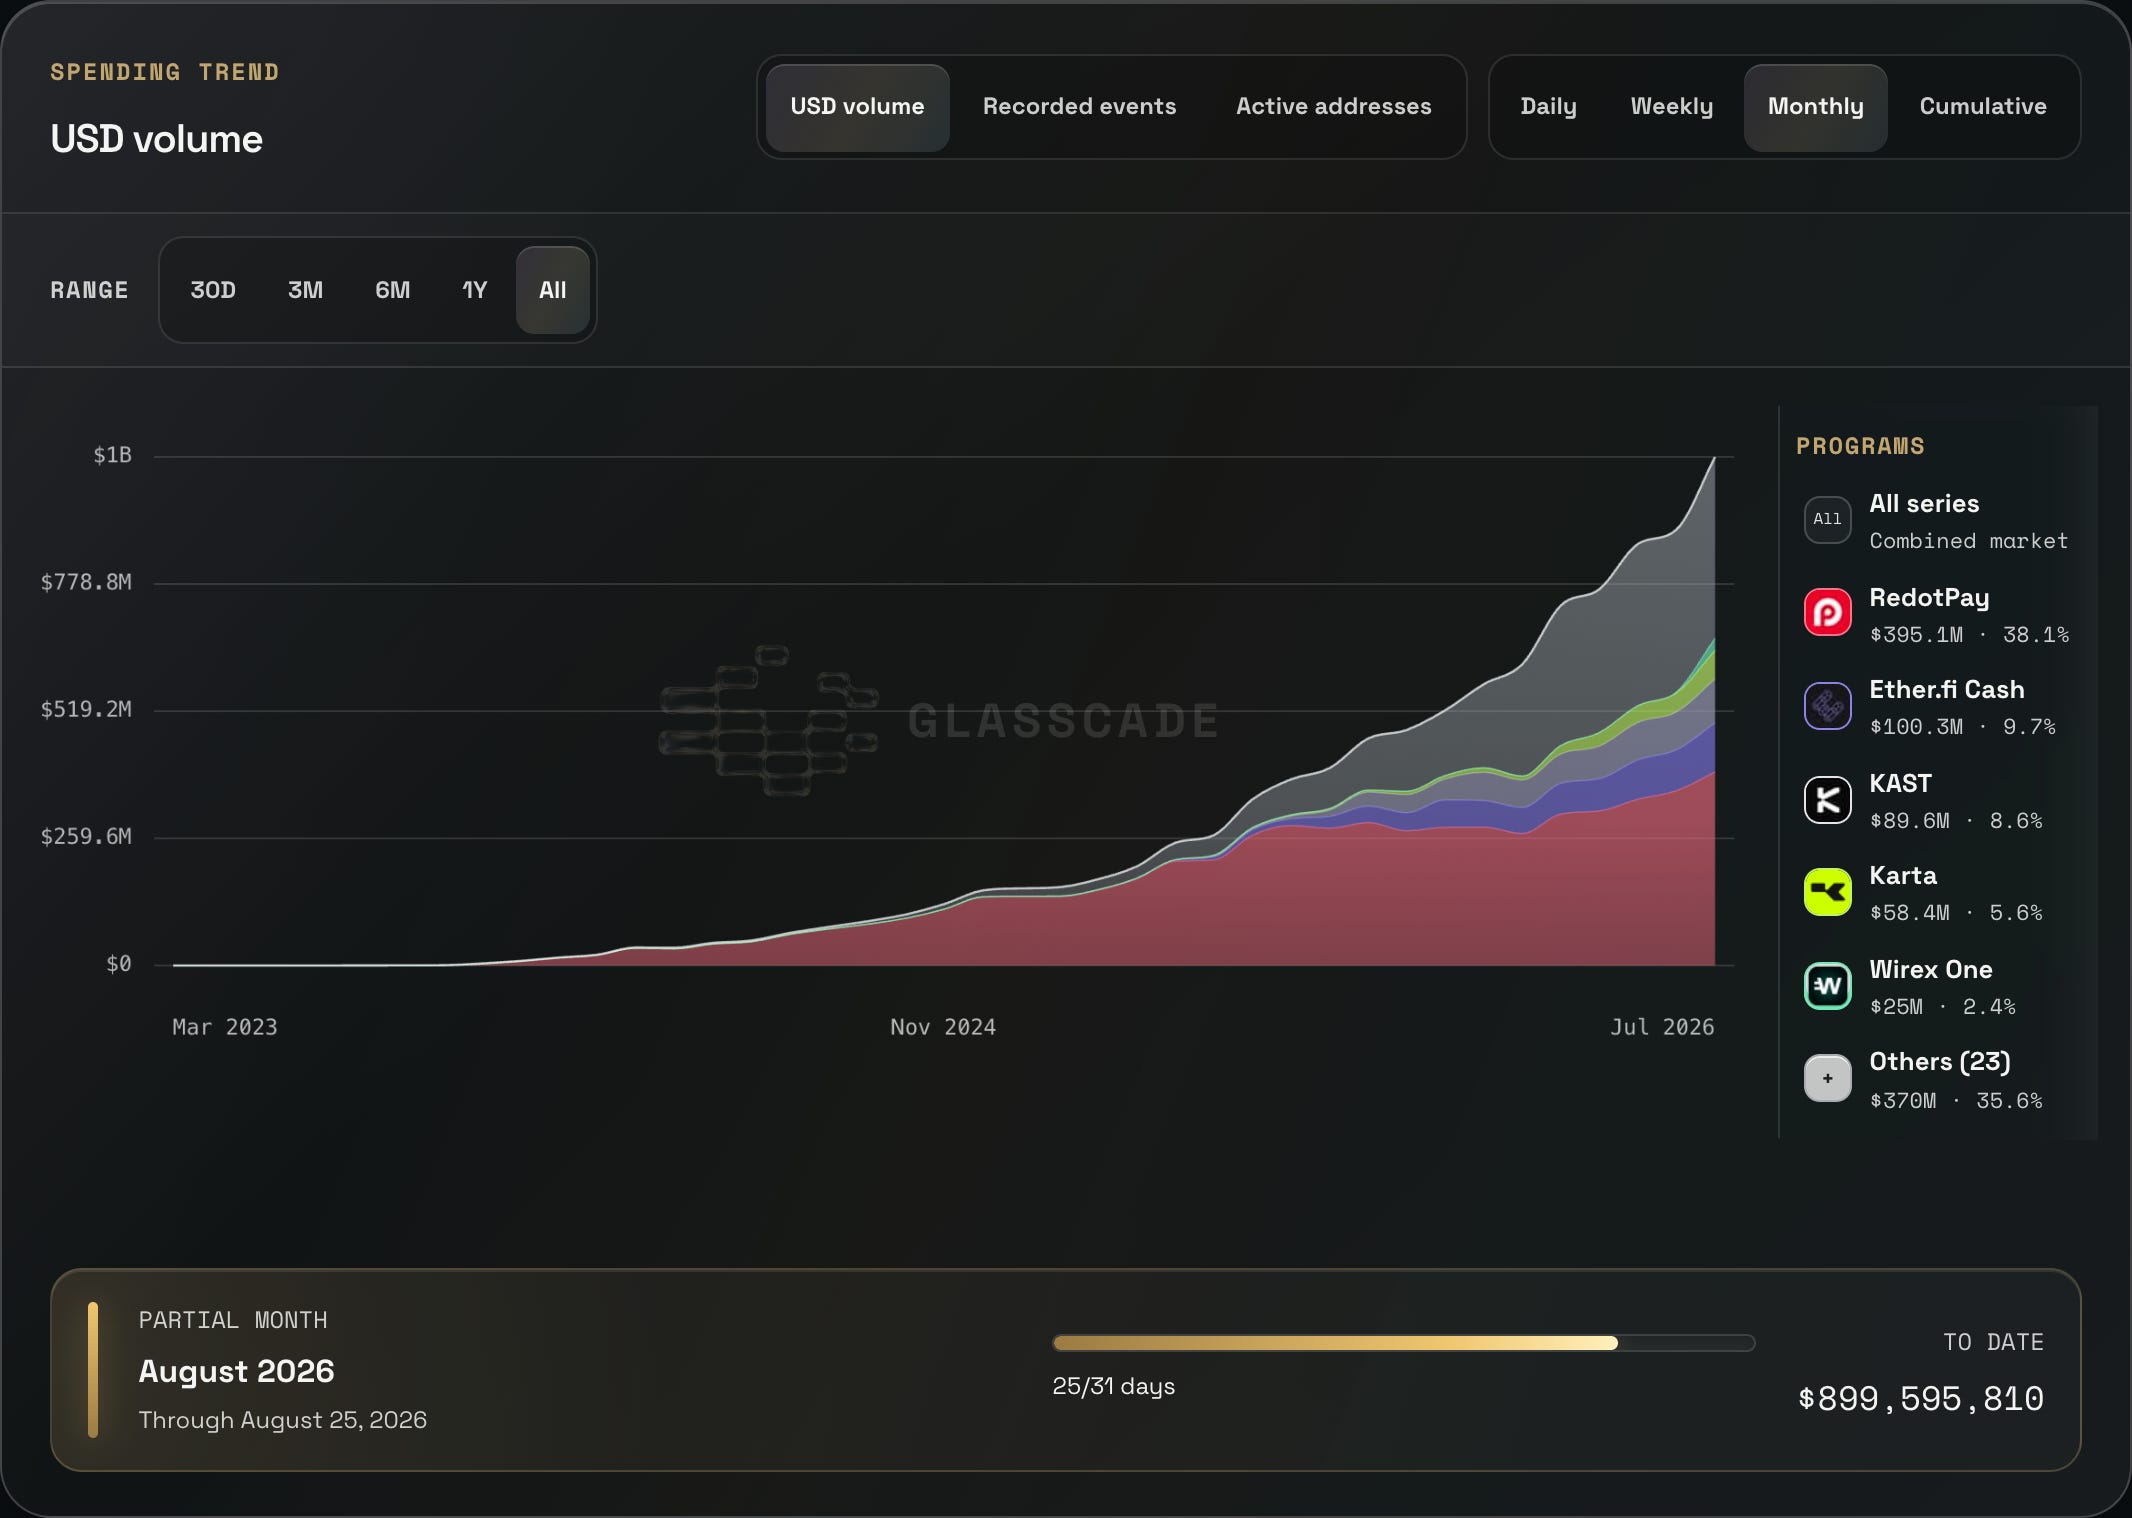
Around 38.1% of July’s tracked volume came from issuer-reported data, the portion taken on the issuer’s word rather than reconstructed from onchain activity.
A further $283.3 million, 27.4% of the market total, was visible through infrastructure but could not be assigned to a named program.
Public rails reveal that the market is growing while still leaving a quarter of it unattributed and more than a third unverifiable.
Question 2: Which Programs Are Changing Fastest?
A market total shows direction. It cannot show which products are accelerating, which are stalling, and which are entering from close to nothing.
Glasscade’s indexed growth view normalizes each program to a common starting point, so a program that began the window at $200,000 and one that began at $200 million can be read on the same axis without absolute size drowning out the trajectory.
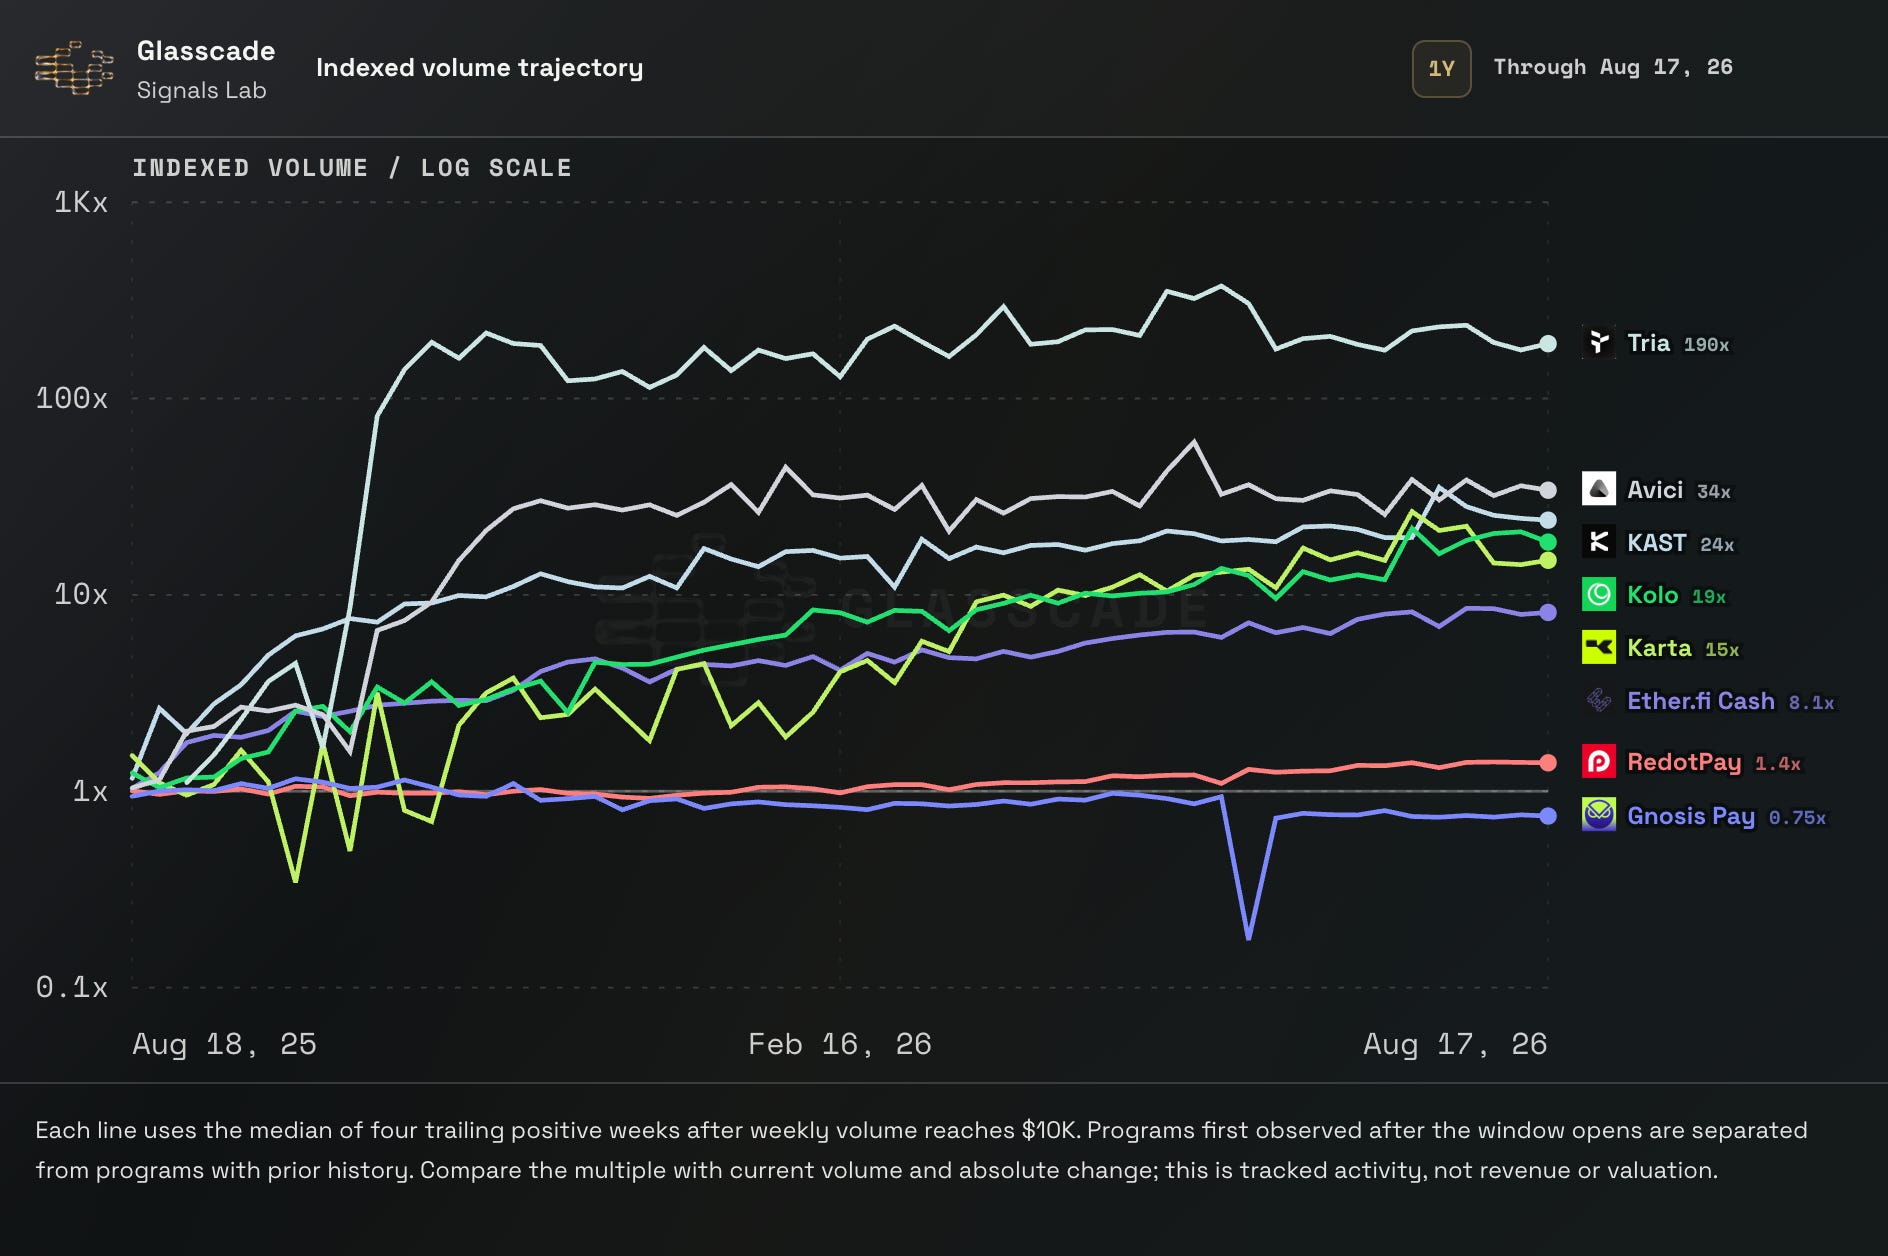
Over the 12 months to Aug 2026, the trajectories separate sharply:
RedotPay’s self-reported card spend sits at 1.4x its starting point, a $25.9 million absolute gain off an already large base
Etherfi Cash’s onchain protocol spend is up 8.1x, adding $20.7 million
KAST’s onchain program-issuer settlement is up 24x, adding $20.2 million
Karta‘s is up 15x, and Tria, from close to nothing, shows 190x
Gnosis Pay runs the other way, at 0.75x, its authorization-stage debit down $630k over the window
These figures describe four source series on their own stated bases. They are not a ranking of revenue, valuation, customer growth, or complete consumer purchases. A 190x multiple can reflect a tiny starting base as easily as a large absolute gain, which is why the indexed view pairs each multiple with its dollar change: to separate the shape of a change from its size.
The purpose of the indexed view is to surface questions like these:
When did growth accelerate?
Was the change sustained?
Did it come from more activity, larger events, or broader address participation?
Those questions are what the rest of this analysis answers.
Question 3: Why Can Similarly Sized Programs Behave Very Differently?
Volume alone conceals the structure of the activity beneath it. Two programs can post the same monthly figure and be doing almost nothing alike.
In July, Etherfi Cash recorded $100.3 million of protocol spend. KAST recorded $89.6 million of program-issuer settlement. The totals were of a similar order, but the underlying event patterns were radically different.
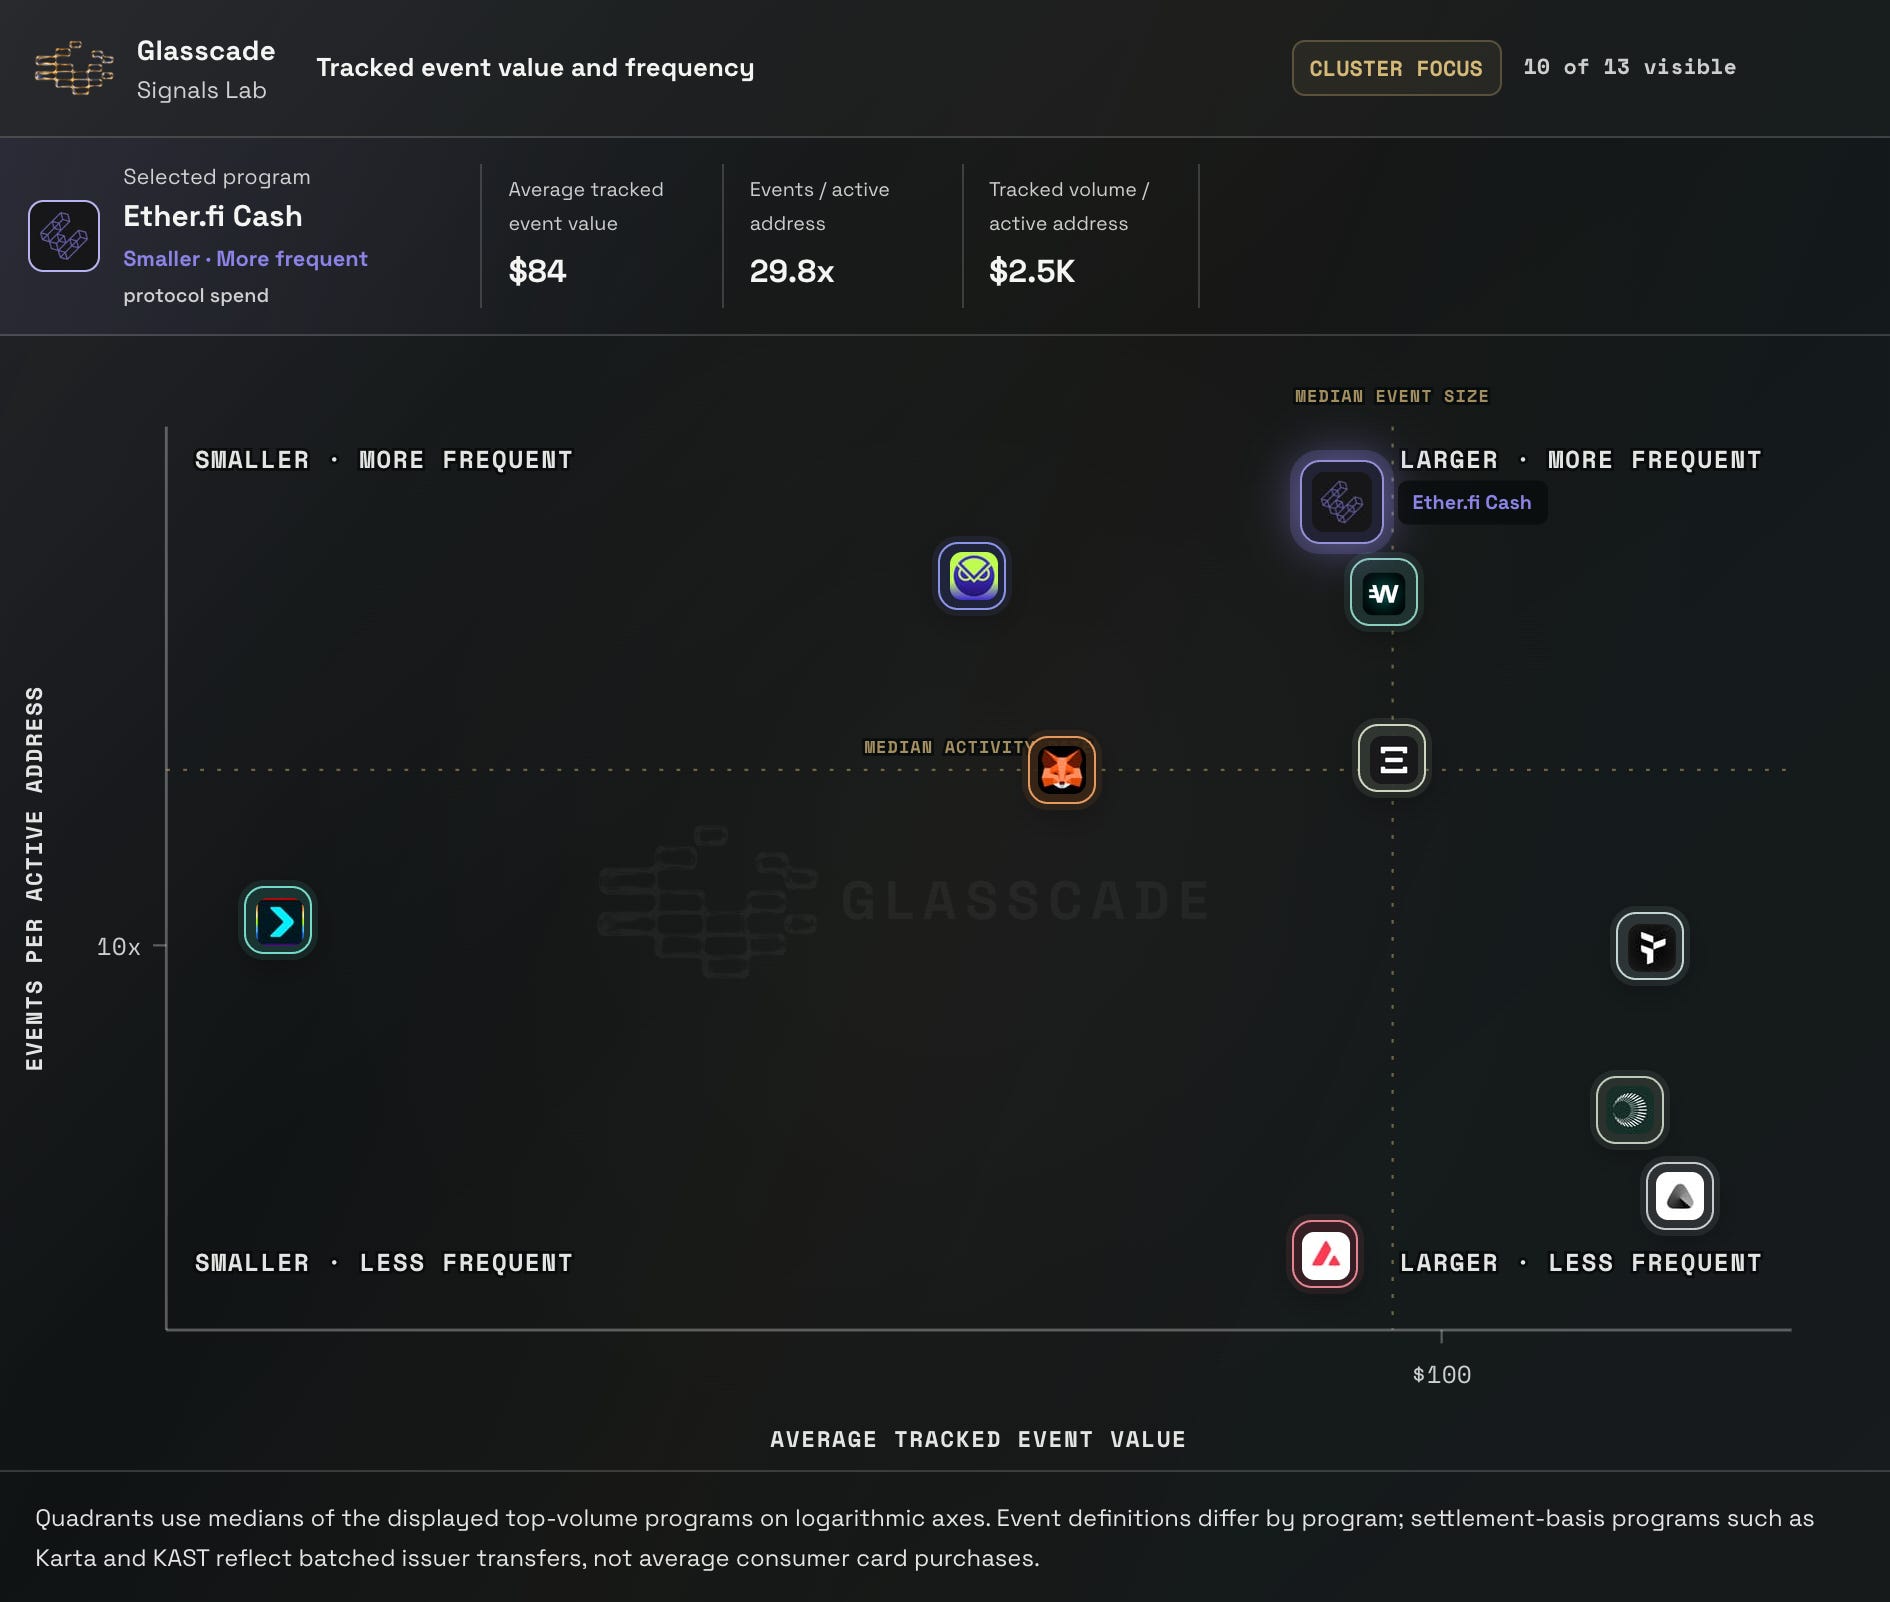
Etherfi Cash’s series contained approximately 1.19 million events across 40,040 active addresses, averaging $84 per event at 29.8 events per address.
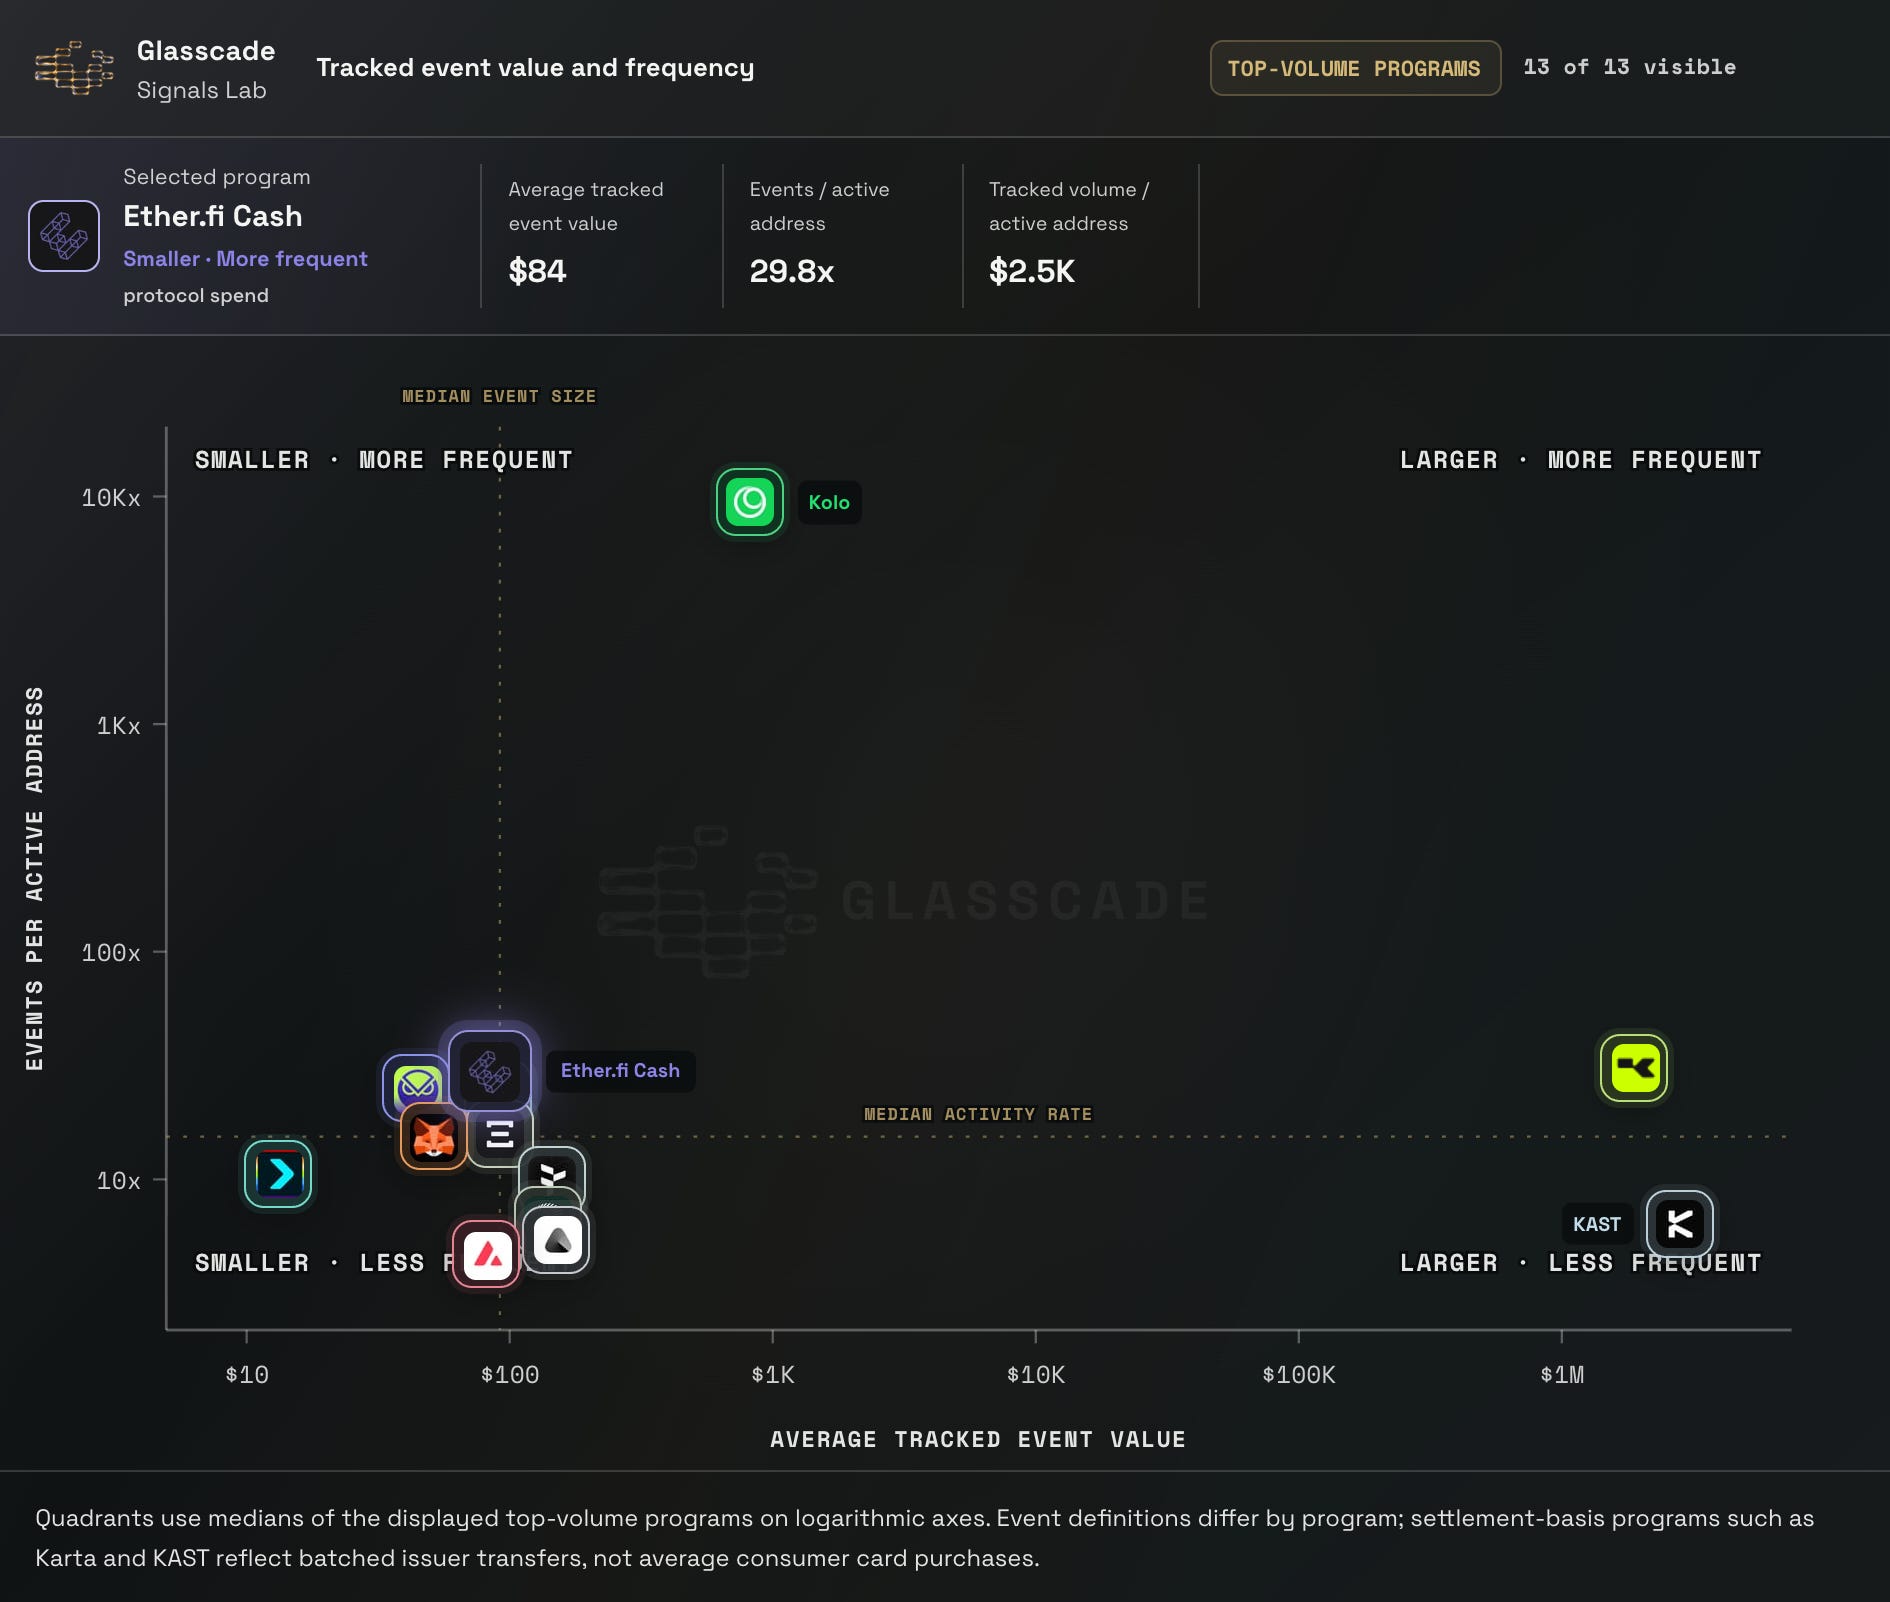
KAST’s settlement series contained 32 events across five active addresses, averaging around $2.8 million per event.
It shows that the two series observe different parts of the payment system. Etherfi Cash exposes protocol-level spend events, while KAST exposes batched settlement between the program and issuer.
Glasscade’s Activity Profile makes these differences visible by plotting average event value against events per active address. Programs with similar tracked volume can occupy entirely different parts of the chart because their products, architecture, and observable activity are different.
Note: Where address-level information is not available, as with RedotPay’s reported series, Glasscade marks the profile unavailable. Unavailable is not zero.
Question 4: Is Growth Coming From New People Or The Same People Doing More?
That last distinction, between what a program measures and what it actually represents, carries into the addresses themselves. A program can lift its volume by bringing new people in or by getting the people it already has to do more, and in a volume chart the two are indistinguishable.
Glasscade’s address lifecycle mix separates them. It groups each program by time since first observation into launching, scaling, and established cohorts, then splits active addresses into new and returning within each period.
It is used to describe the balance of first-seen and previously-seen addresses in a window, not whether individuals stayed loyal over months.
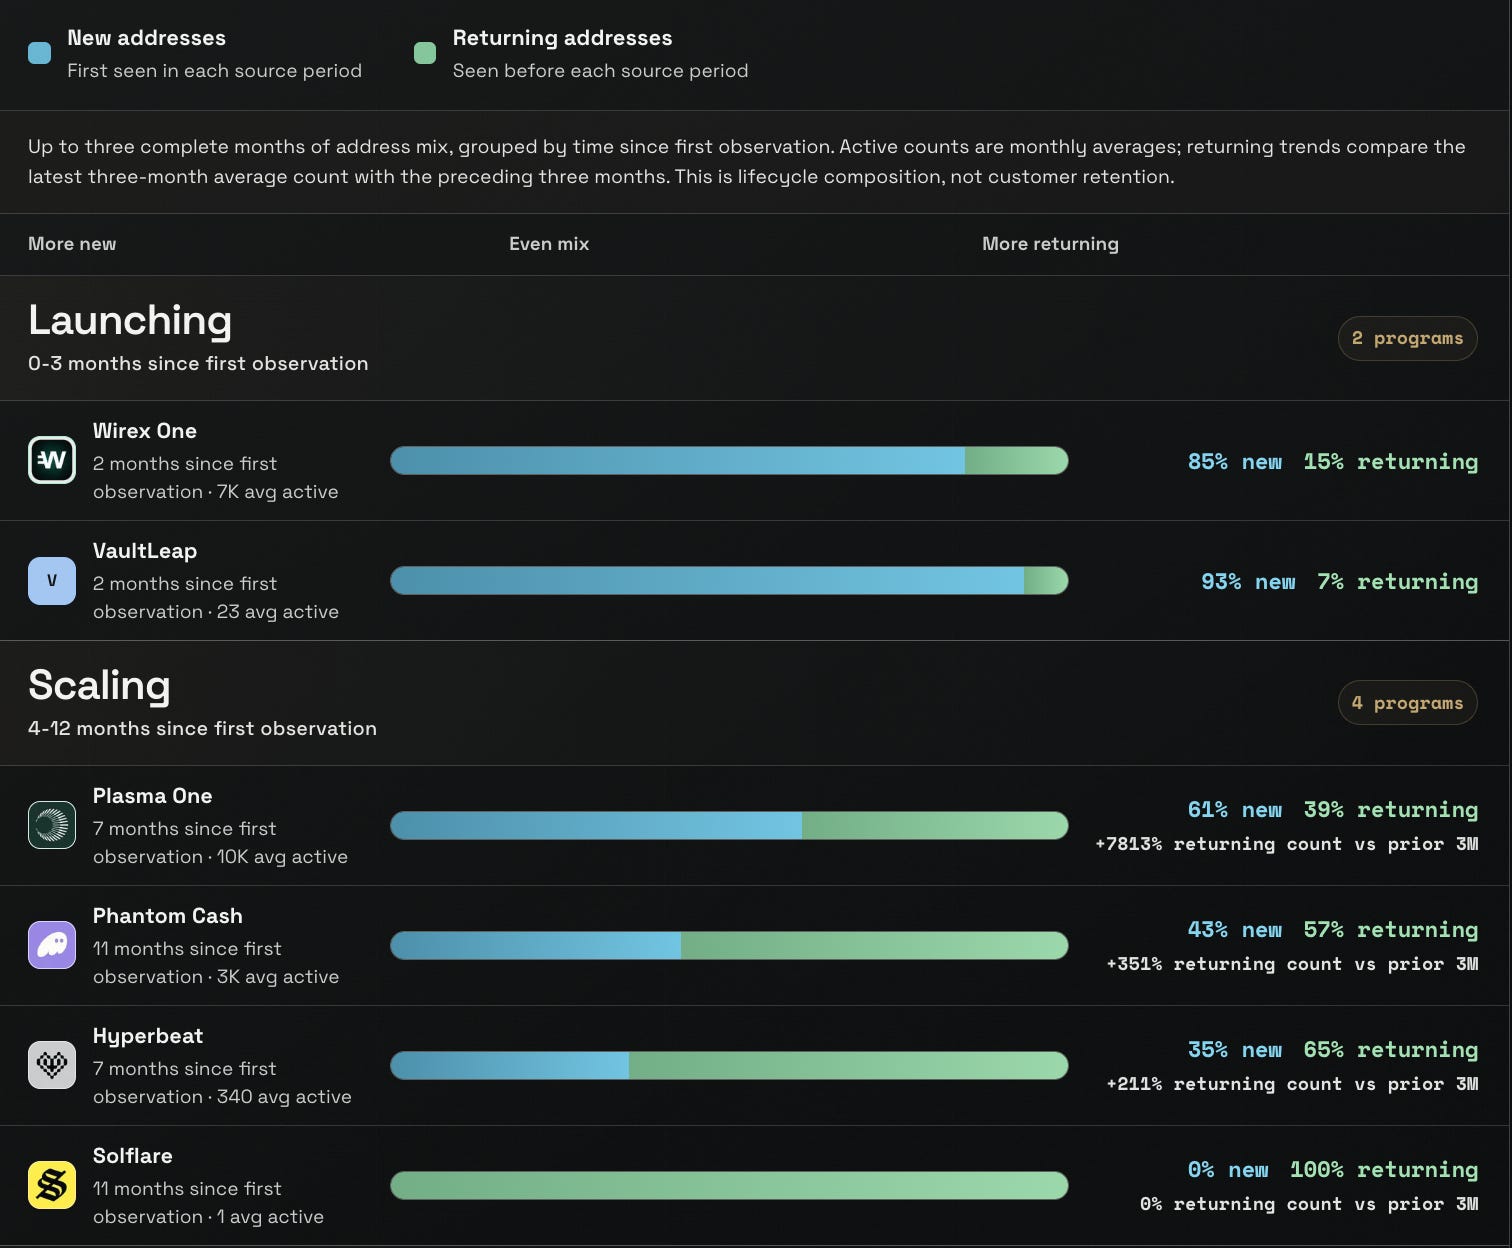
Wirex One, two months into observation, runs 85% new against 15% returning, the signature of a program still acquiring.
Phantom Cash, eleven months in, has crossed over to 43% new and 57% returning, with its returning-address count up 351% on the prior three months.
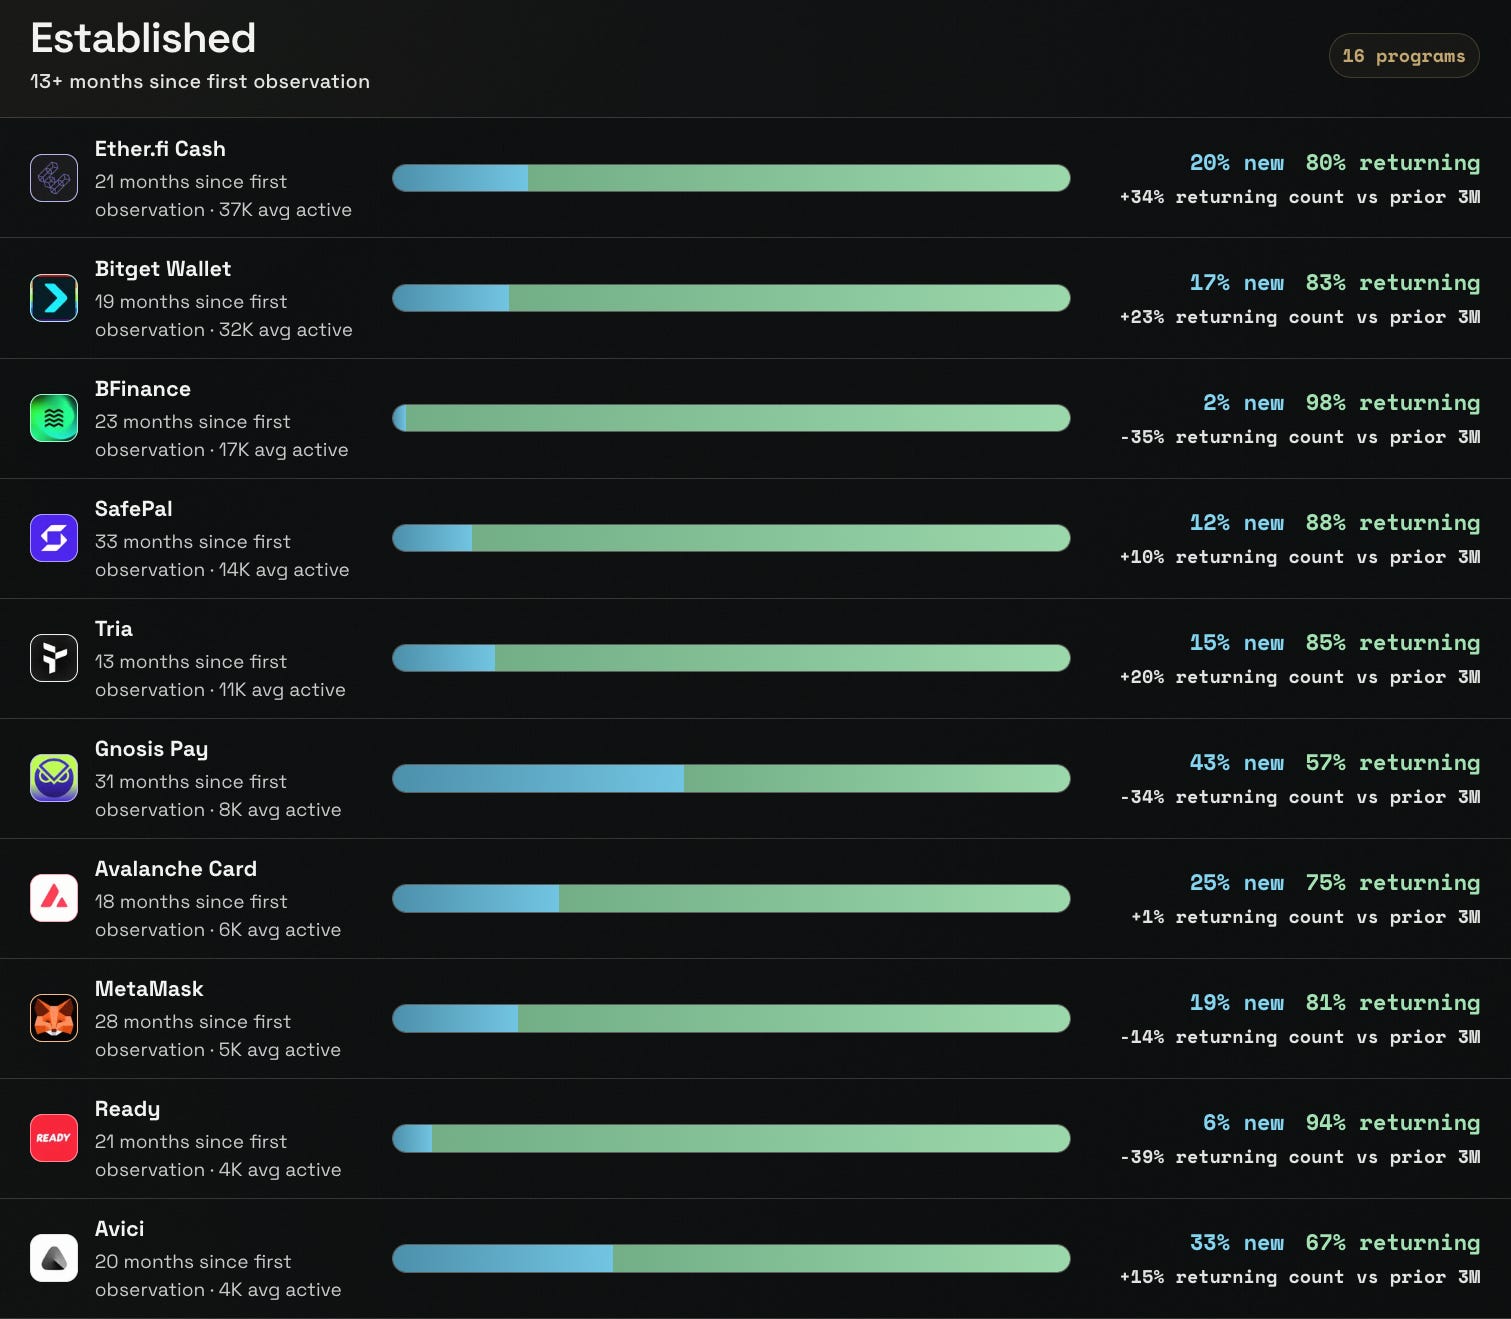
Etherfi Cash, established at 21 months, sits at 20% new and 80% returning, a program running largely on the base it already built.
Composition only carries meaning read against the program’s age and its absolute active count, both of which sit beside it in the same view.
Note: address mix is unavailable for RedotPay’s reported series.
Caught your attention yet? Subscribe to Glasscade to not miss out on these insights.
Question 5: When A Number Moves, What Actually Moved?
Percentage growth is a headline with its cause removed. A program up 45% has told you the direction and withheld the mechanism, and the mechanism is what decides whether the growth survives the next quarter.
Glasscade’s growth decomposition breaks a change in tracked volume into three factors that multiply together to produce it:
1) The number of active addresses
2) The number of tracked events per address
3) The average value of those events
The three reconcile to the observed change rather than approximating it, so the decomposition accounts for the movement in full.
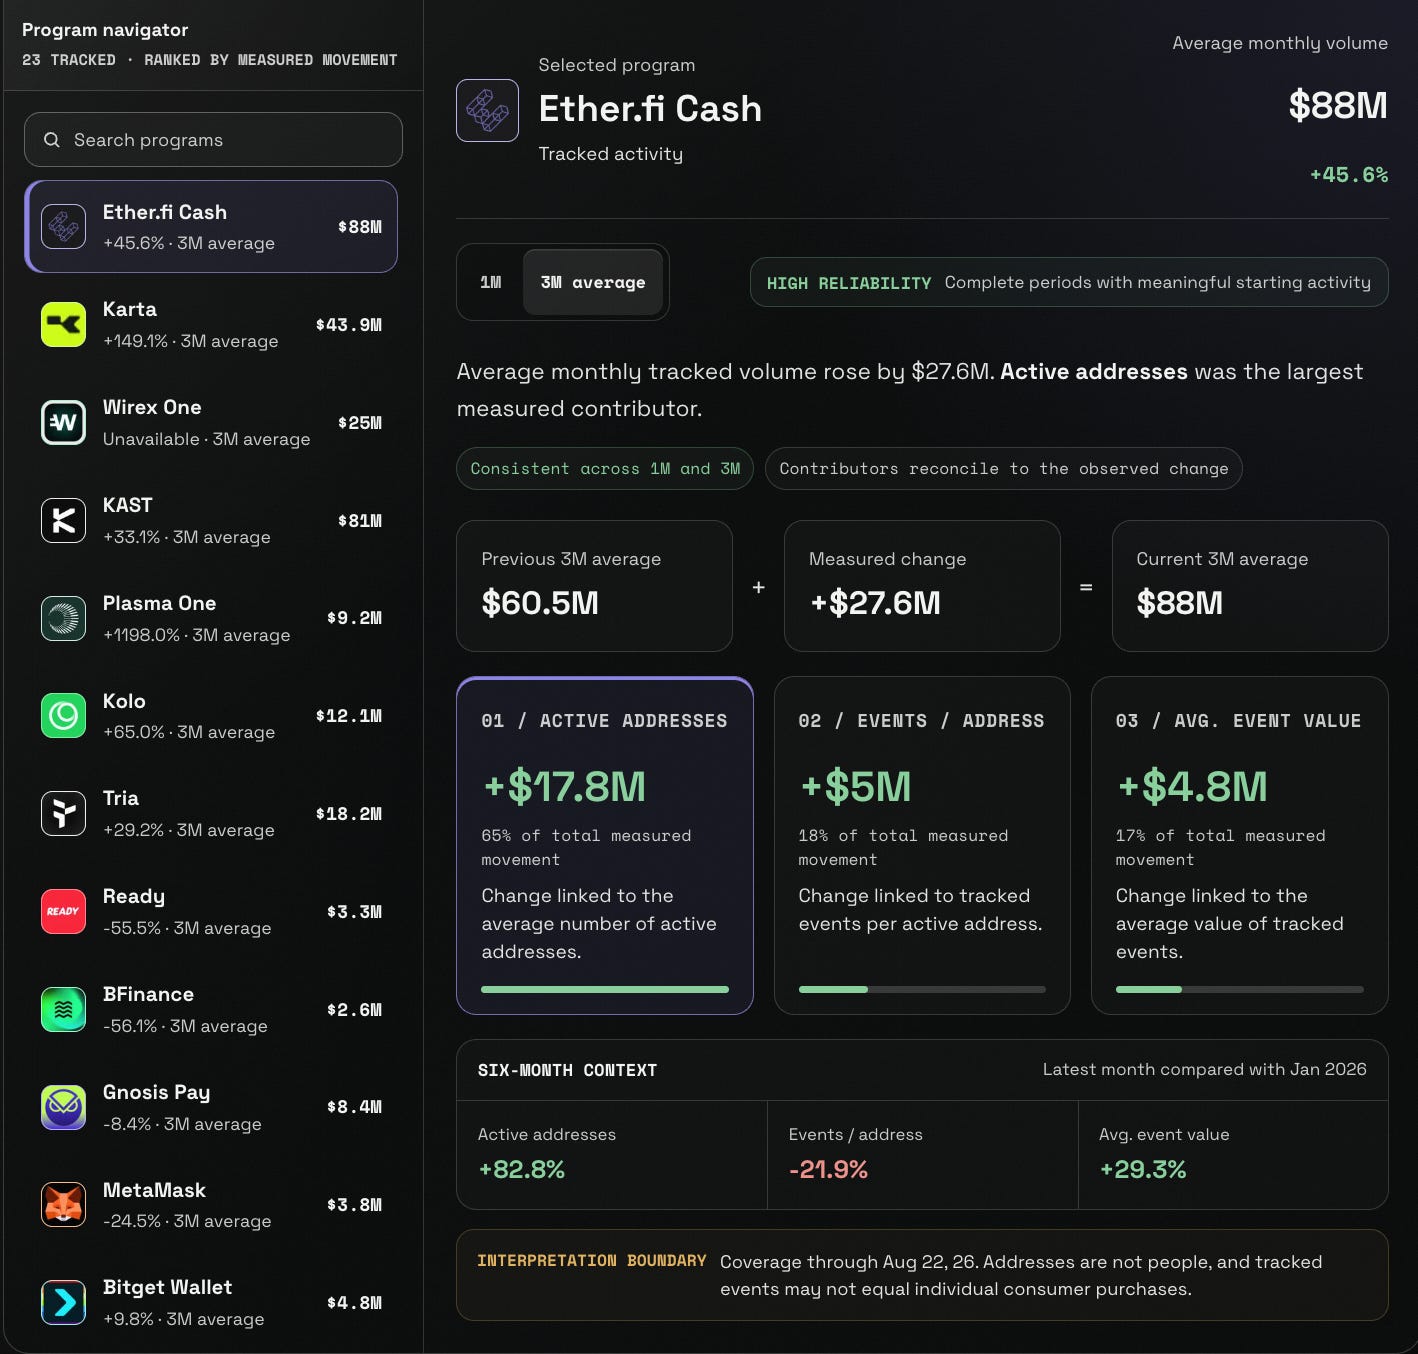
Etherfi Cash’s average monthly tracked volume rose $27.6 million, a 45.6% increase from a $60.5 million base to $88 million
Active addresses contributed $17.8 million of that, 65% of the movement
Tracked events per address added $5 million, 18%
Average event value added $4.8 million, 17%
The growth that we observe is led by participation, instead of having the same wallets spend harder.
The six-month view complicates it in a useful way.
Active addresses rose 82.8% and average event value rose 29.3%,
Tracked events per address fell 21.9%
More people, larger transactions, but each address transacting less often - three forces a single growth percentage would have hidden entirely.
Decomposition isolates what moved. It does not explain why each factor moved, which is the next question to settle.
Question 6: How Much Of This Can We Independently See?
Everything to this point has taken the tracked figures at face value.
The decomposition down to the level of a single address invites the question that sits underneath the whole dataset: how much of it can anyone actually verify?
Not all tracked volume is equal in provenance. Some is reconstructed from onchain activity that anyone can independently check. Some is reported by the issuer and accepted on trust. The ratio between the two is itself a reading on how legible the market has become.
Glasscade tracks that ratio as a moving series. Issuer-reported data made up 38.1% of tracked volume in the latest complete month, with the other 61.9% attributed onchain.
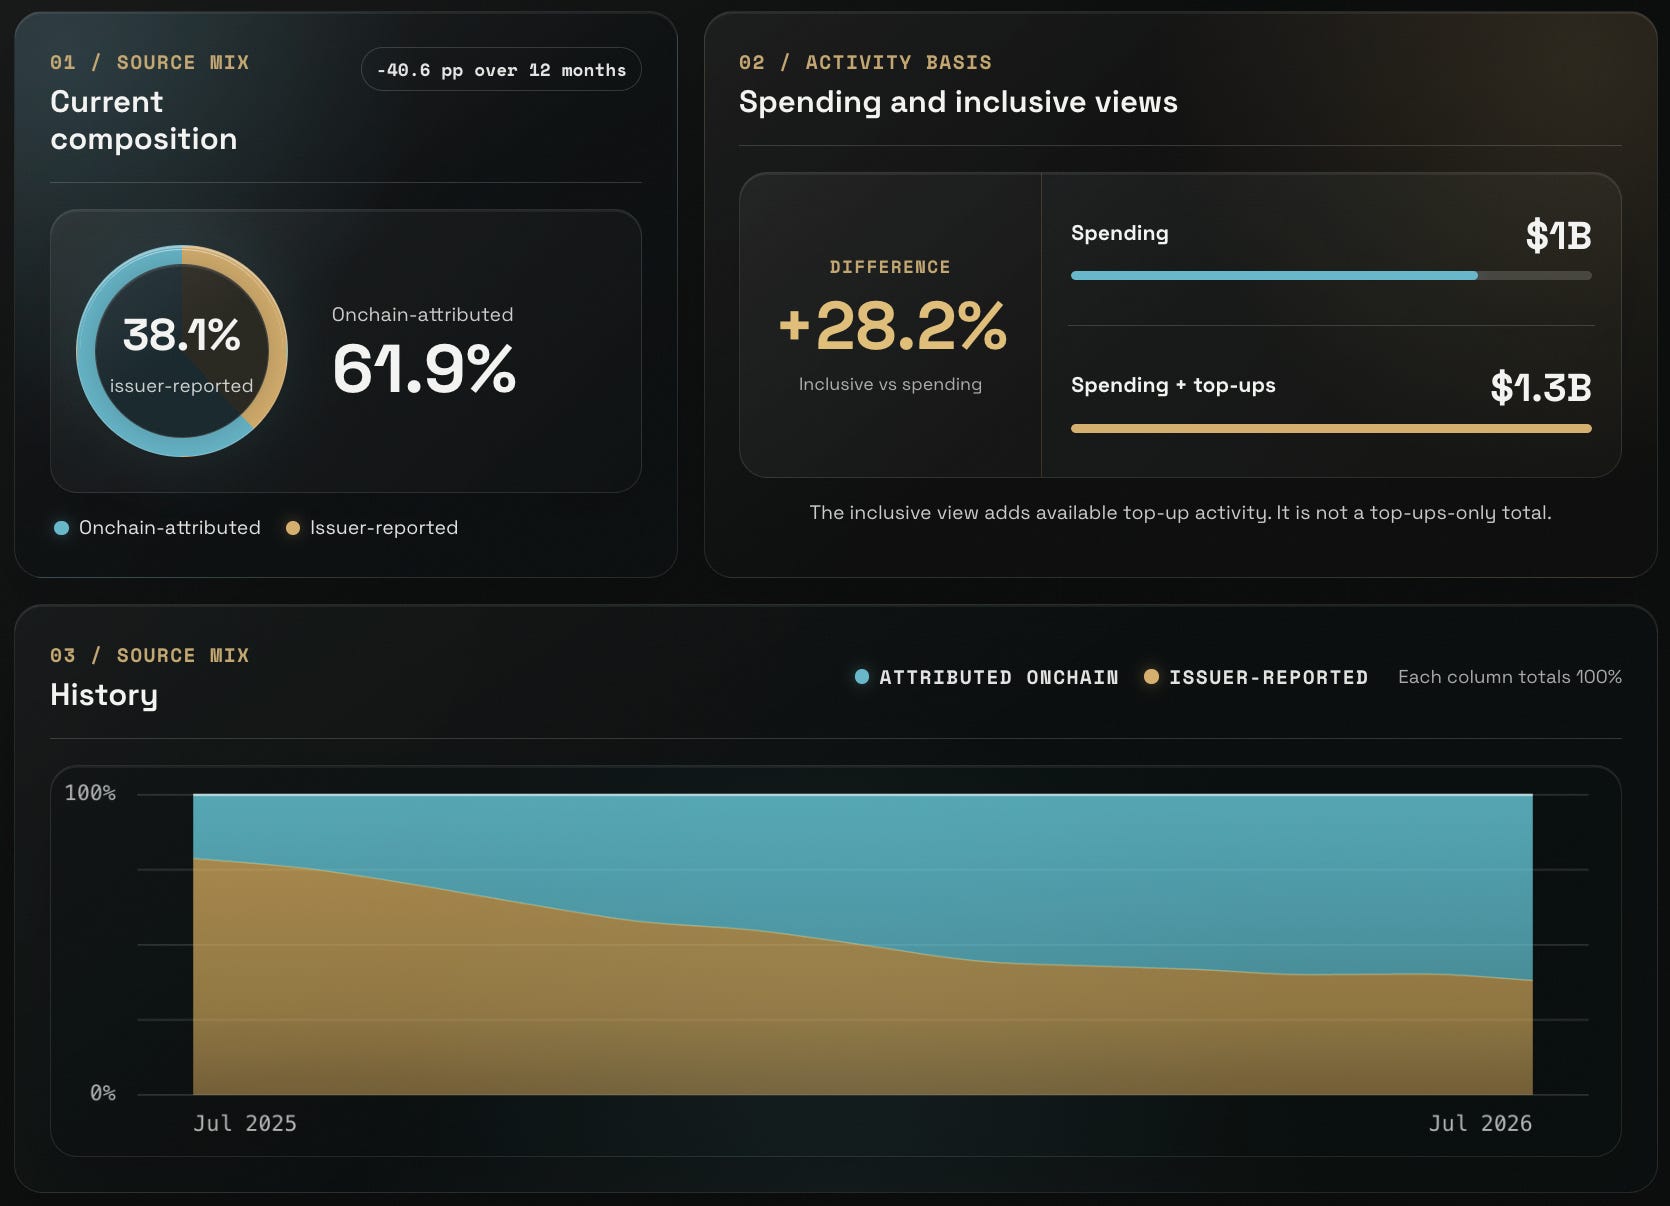
Twelve months earlier the reported share was far larger; it has fallen 40.6 percentage points over the year. A market that once relied heavily on self-reported figures now reconstructs most of its volume from public rails.
The same view separates two things that are easy to blur. Spending measures value leaving cards. Spending plus top-ups adds the funding side, value moving in. The inclusive view runs 28.2% above the spending-only view, $1.3 billion against $1 billion.
Note: The inclusive view adds available top-up activity where it exists; it is not a top-ups-only total, and the gap between the two views is not uniform across programs.
Question 7: Underneath The Programs, Who Actually Carries The Volume?
A card program is a brand sitting on top of a stack it mostly did not build. The issuer, the chain, the stablecoin, and the network beneath it are where the real concentration lives, and it looks nothing like the leaderboard of program names.
Glasscade resolves tracked volume down to each layer of that stack, and the four layers do not share a shape.
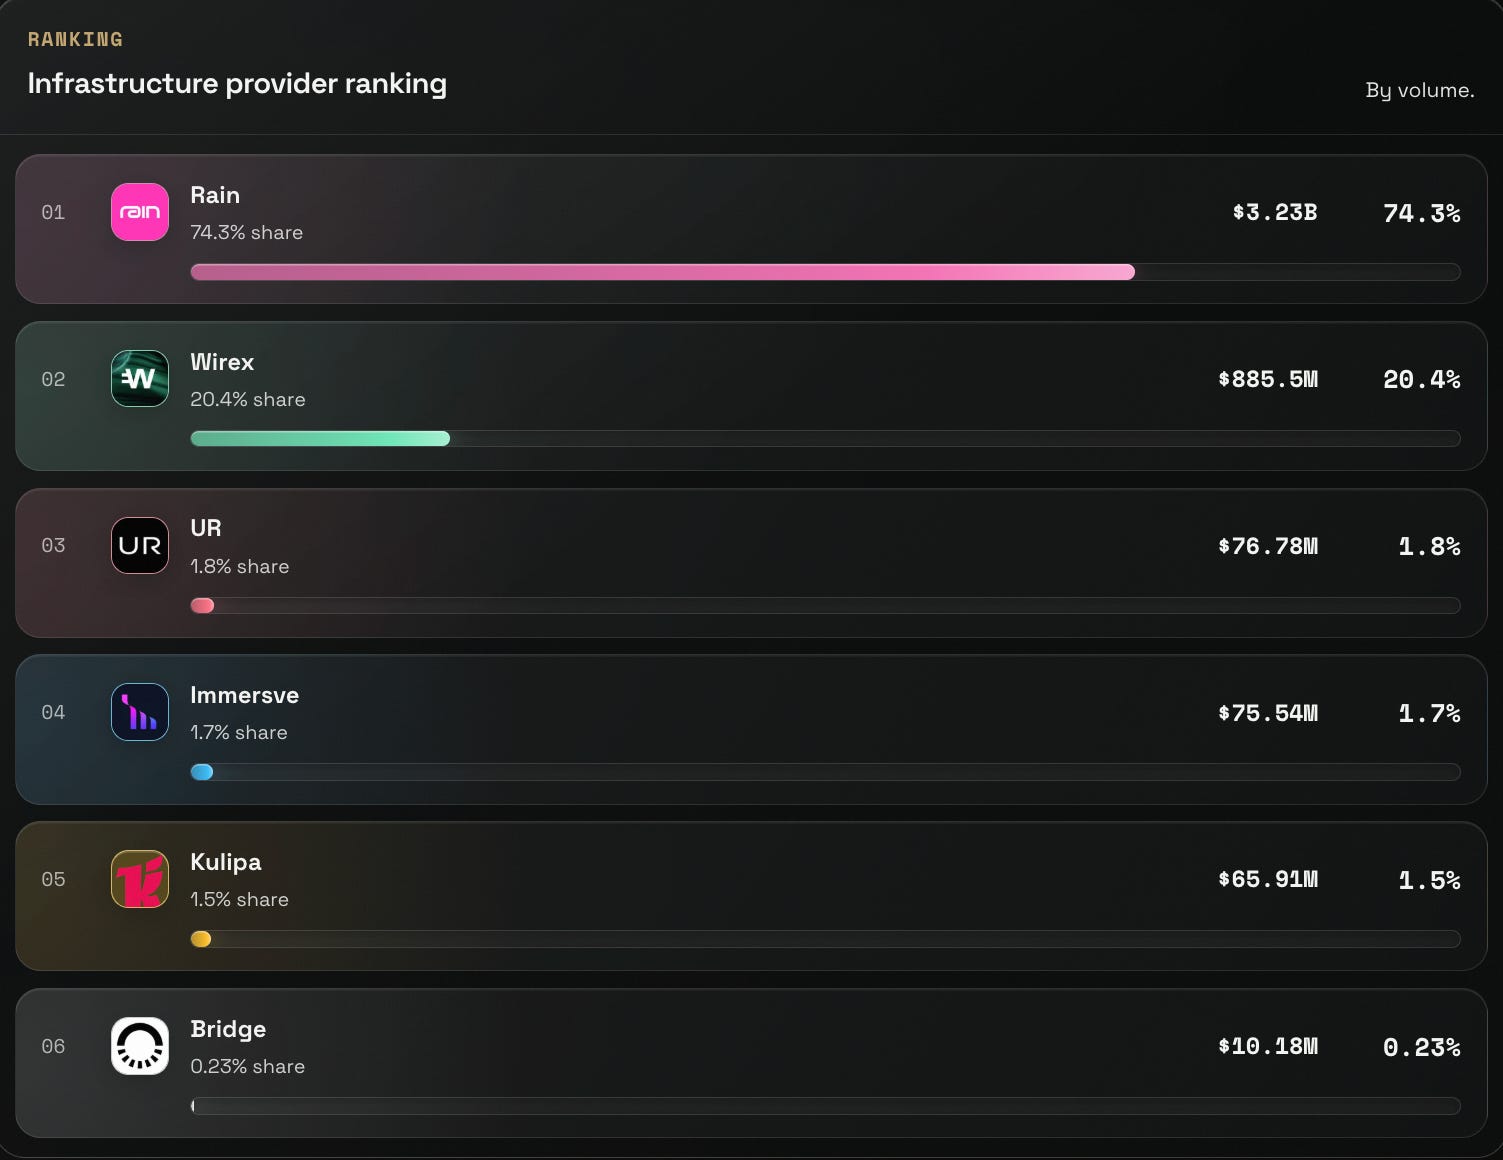
The issuing layer is close to a monopoly.
Rain carries 74.5% of tracked infrastructure-provider volume at $3.23 billion
Wirex sits second at 20.4% at $886 million in volume
The remaining providers, UR, Immersve, Kulipa, and Bridge, divide roughly 5.3% between them.
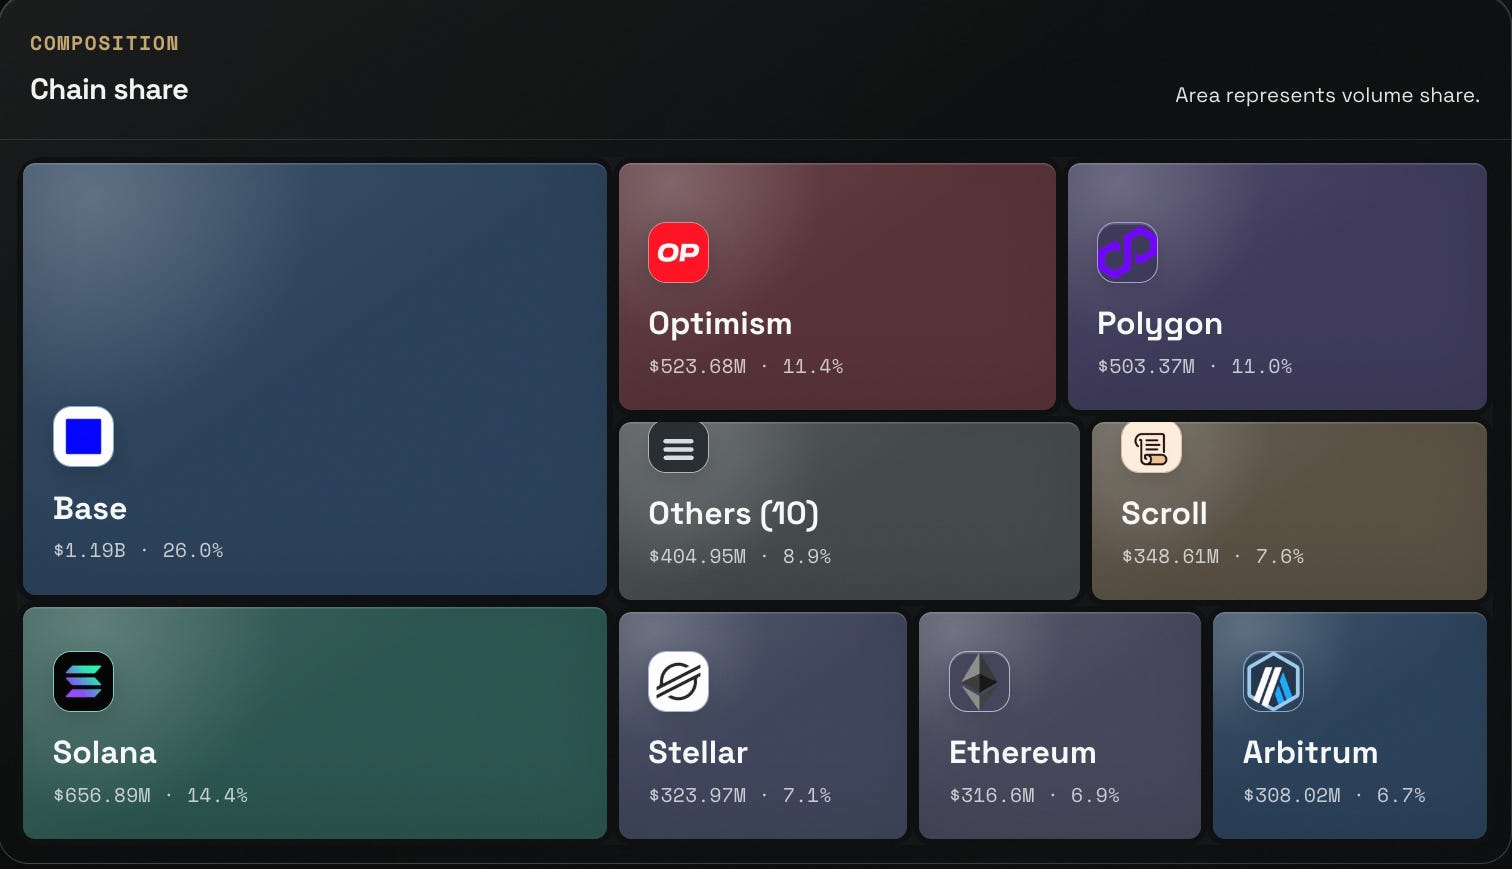
The chain layer is fragmented.
Base leads at 26% of tracked chain volume
Solana at 14.4%
Optimism at 11.4%
Polygon at 11%
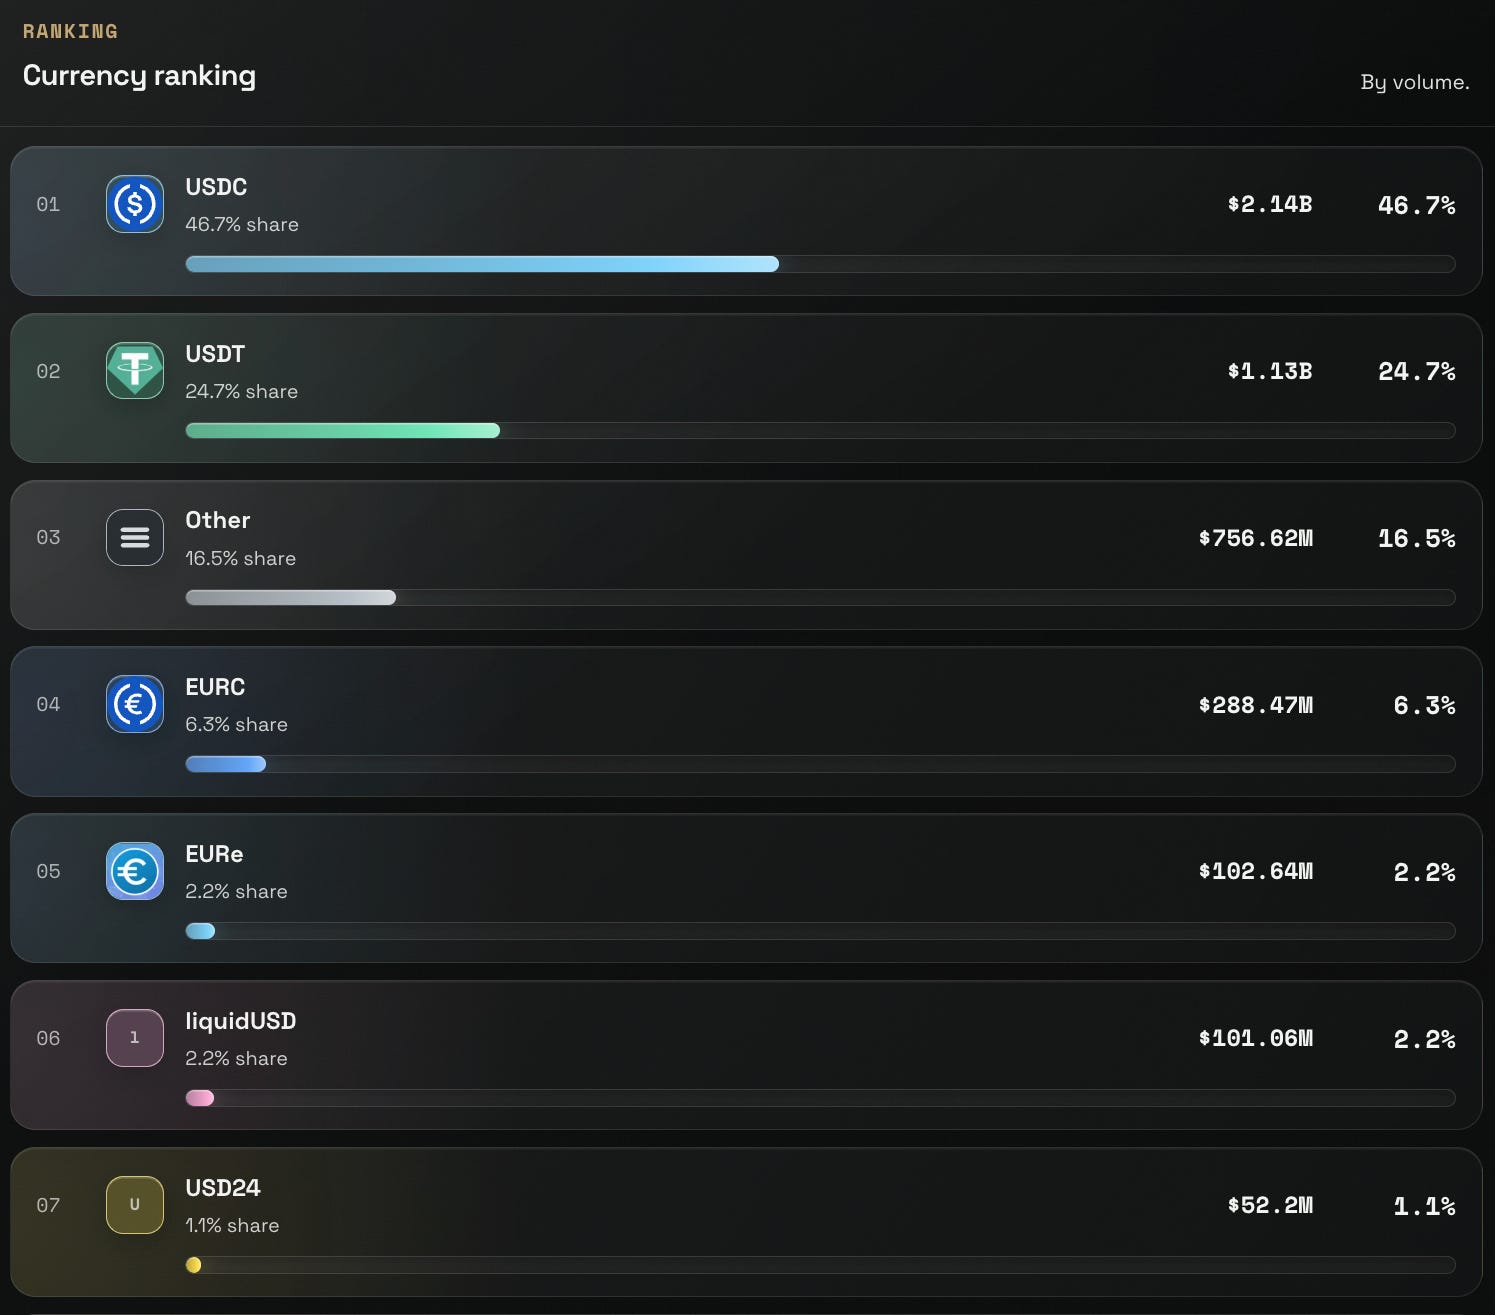
The currency layer runs on dollars with a widening euro edge.
USDC holds 46.7% and USDT 24.7%
Euro-denominated stablecoins form a measurable slice of their own, EURC at 6.3%, EURe at 2.2%, and GBPe beneath them.
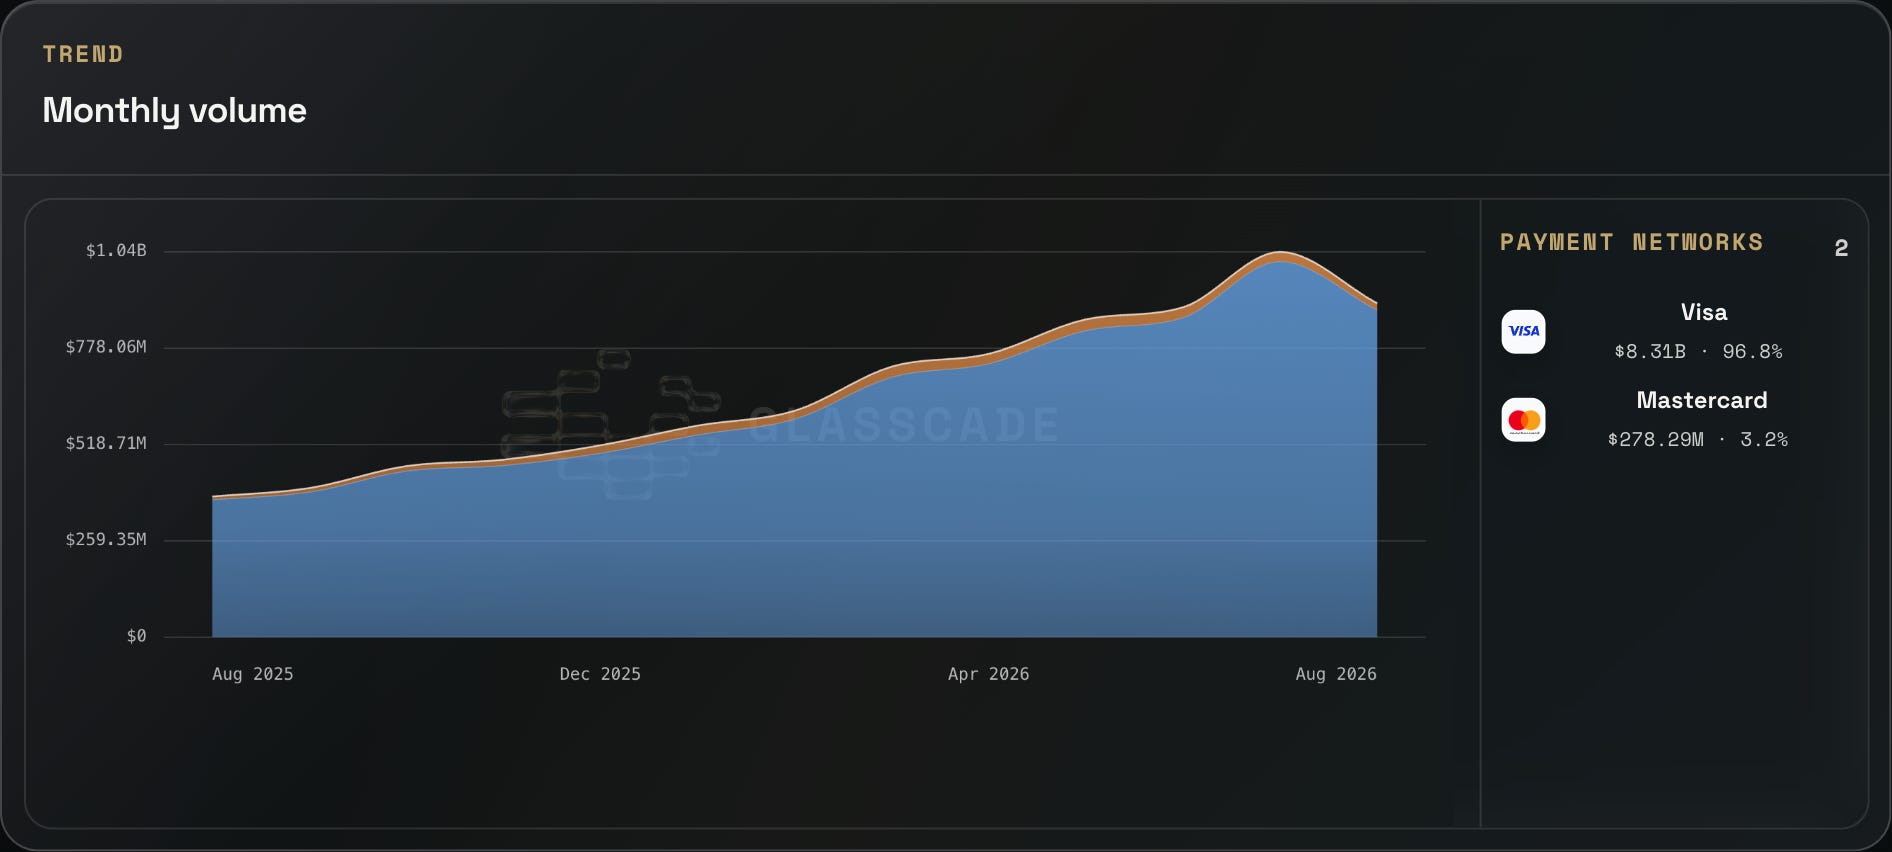
The network layer is effectively settled.
Visa carries 96.8% of tracked network volume against Mastercard’s 3.2%.
The stack concentrates at the issuing and network layers and fragments across chains and currencies, and a program’s choices along those four lines largely decide what of it appears onchain in the first place.
Question 8: Is This Market Consolidating Or Opening Up?
The stack shows where volume sits today. Yet, it blurs the way the whole market is tilting, and that is an important question every individual program’s rise or fall has been circling.
Glasscade measures market structure with four indicators tracked over twelve months, to provide a view which best depicts the macro landscape.
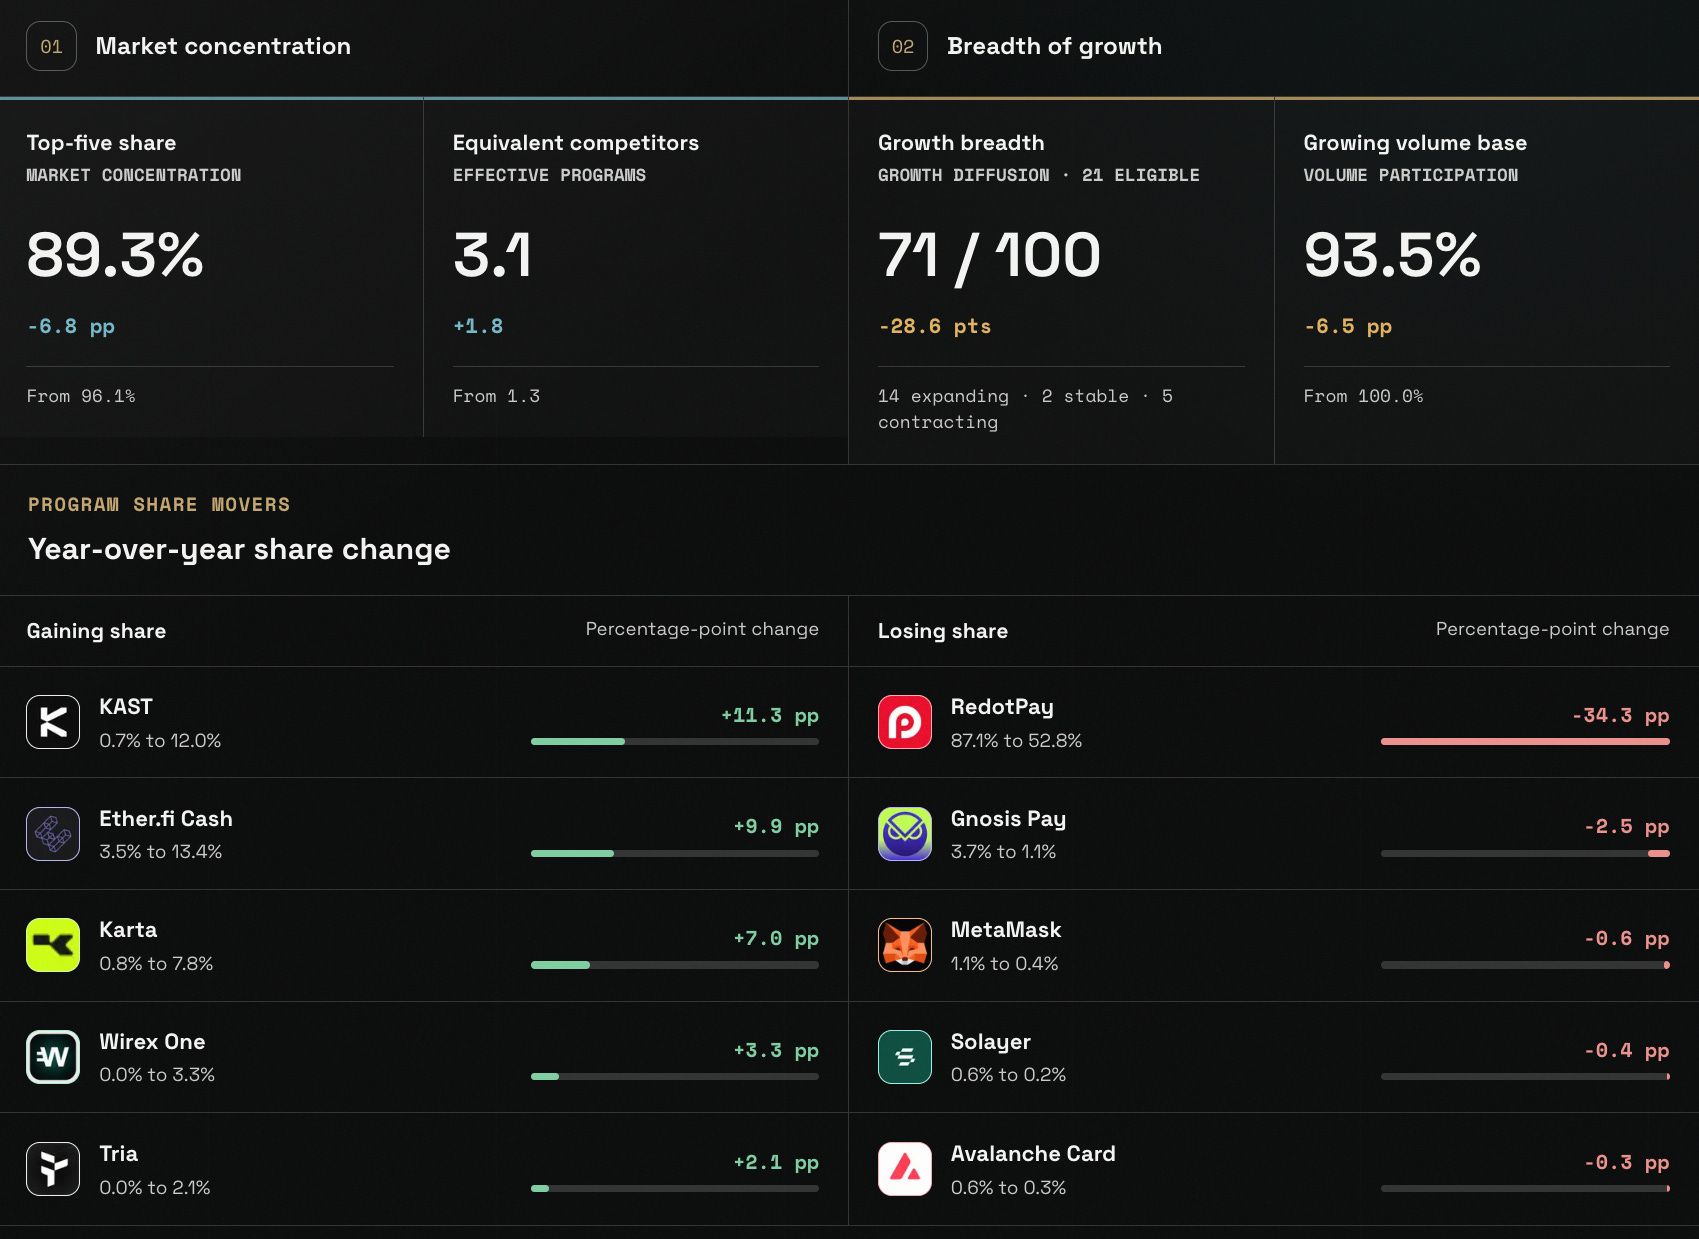
The clearest is effective programs, one divided by the sum of squared program shares, which returns the number of equally-sized programs the market behaves as if it had. It rose from 1.3 to 3.1 over the year. A market that once acted like barely more than a single program now acts like roughly three.
The other three indicators point the same way. Top-five share of named-program volume fell from 96.1% to 89.3%.
RedotPay alone shed a third of the market, from 87.1% of named-program volume to 52.8%, down 34.3 percentage points, while KAST gained 11.3 points and Etherfi Cash 9.9 points.
The dominant name is still dominant, and considerably less so than a year ago.
Growth breadth moved the opposite way. Diffusion, which weights expanding programs full, stable programs half, and contracting programs not at all, fell from 100 to 71.
Concentration eased at the same time as growth stopped being broadly shared, the combination that tends to describe a market maturing rather than one simply getting bigger.
From Data To Actionable Meaning
Public blockchains made financial activity visible. Visibility is not understanding.
A transfer that anyone can see still does not announce whether it was a payment, a settlement, or a top-up, and the work that closes that gap is not more data but the interpretation layer that says what each number is and what it is not.
That is what Glasscade maintains: a standing answer to what the visible activity actually means, honest about the point where the evidence stops, and useful to the people building, studying, and investing in them.
Methodology note: July 2026 is the latest complete month. USD values are source-assigned. Activity definitions differ by program, address counts are not customer counts, and market address totals are not deduplicated across programs. Data may be incomplete or revised.
The information contained in this report and by Glasscade and related affiliates is for general informational purposes only and is not intended to provide legal, financial, or investment advice. The report should not be construed as an offer or solicitation to buy or sell any security, token, or financial instrument and does not represent any recommendation or endorsement of any investment or financial product or service. Glasscade and related affiliates are not registered as a securities broker-dealer or an investment advisor in any jurisdiction or country.
Subscribe to Glasscade to receive valuable insights on stablecoin cards, neobanks, and onchain FX.